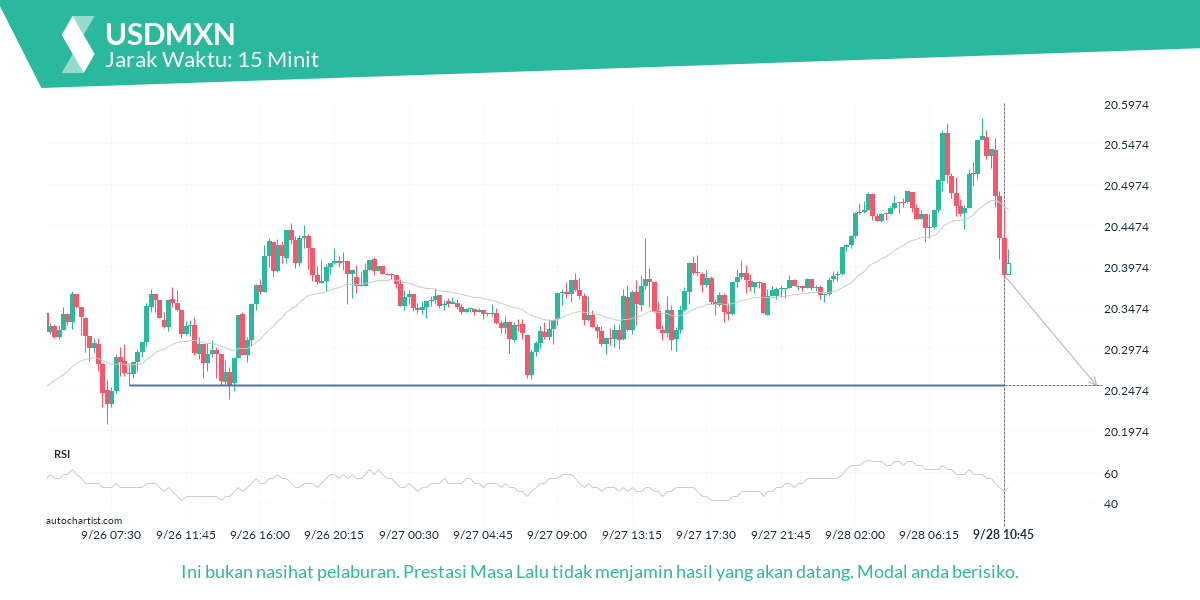
USDMXN sedang bergerak ke arah garis 20.2518 yang telah diuji beberapa kali pada masa lalu. Kami telah melihatnya menjejaki semula daripada kedudukan ini pada masa lalu, jadi pada peringkat ini tidak jelas sama ada ia akan melanggar harga ini atau melantun semula seperti yang berlaku sebelum ini. Jika USDMXN meneruskan trajektori semasanya, kita mungkin melihatnya bergerak ke arah 20.2518 dalam 12 jam.

Bagi anda yang tidak percaya kepada trend, ini mungkin peluang untuk memanfaatkan sejumlah besar bearishcandle berturut-turut pada S&P 500. Pergerakan berlaku sepanjang 8 hari. Bagi anda yang mengikuti trend, anda mungkin berfikir untuk mengikuti trend ini.

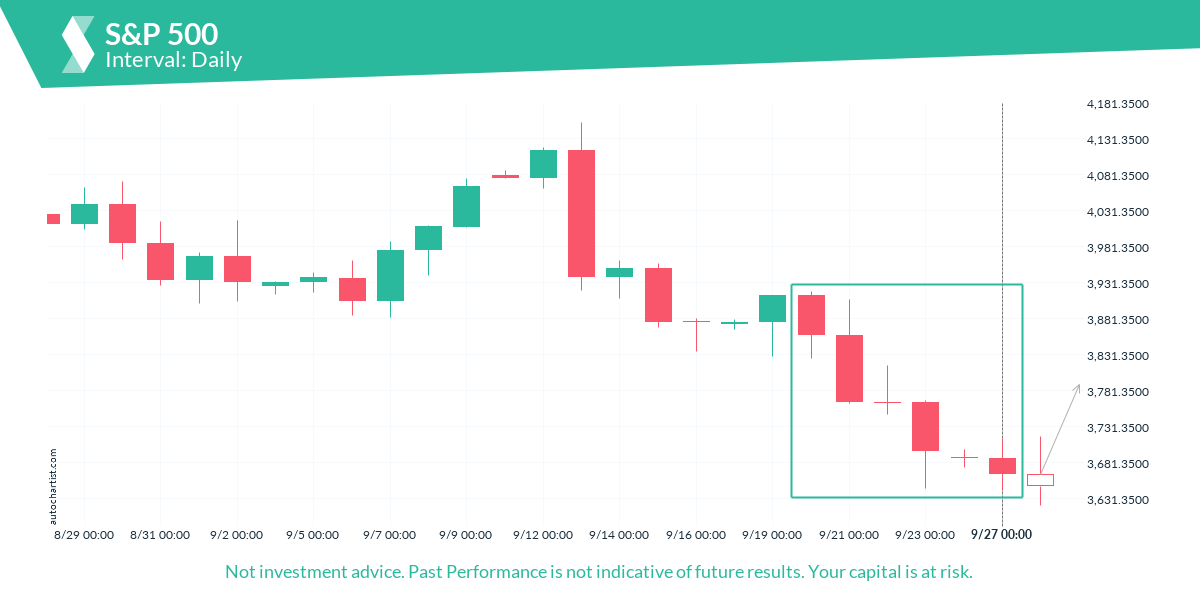
สำหรับผู้ที่ไม่เชื่อในแนวโน้ม นี่อาจเป็นโอกาสใช้ประโยชน์จากการเกิดแท่งเทียน bearish จำนวนมากติดต่อกันสำหรับ S&P 500 การเคลื่อนตัวได้เกิดขึ้นในช่วง 8 วันที่ผ่านมา สำหรับผู้ที่กำลังติดตามแนวโน้มนี้อยู่ คุณอาจเกาะไปกับเทรนด์นี้ได้
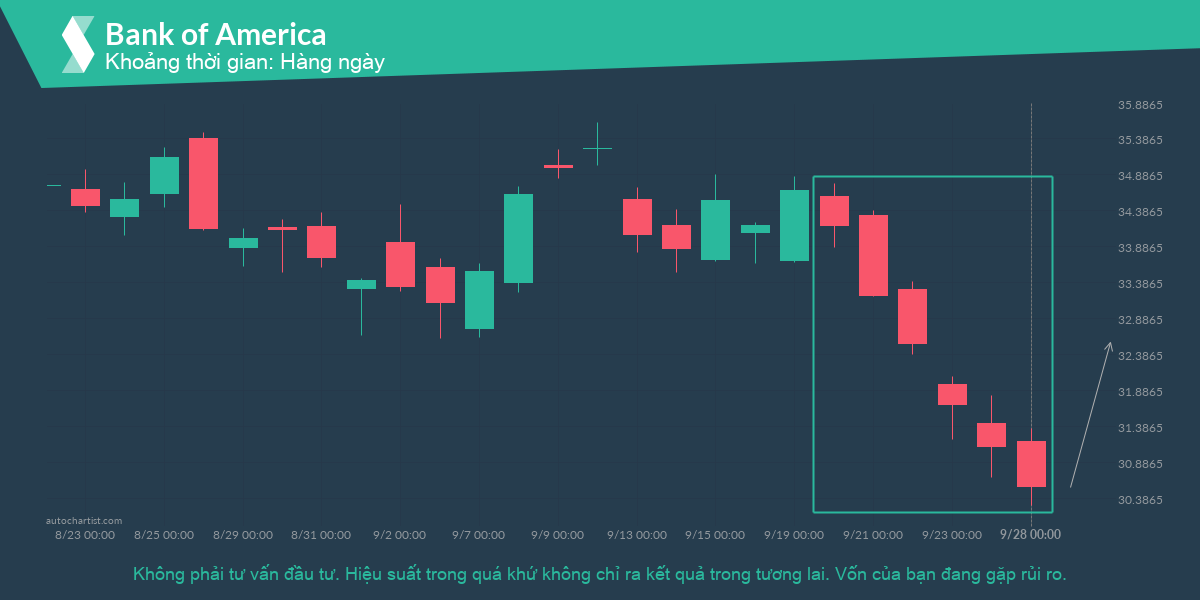
Bank of America đã giảm sau 6 nến hàng ngày liên tiếp từ 34.59 tới 30.54 trong 9 ngày qua.
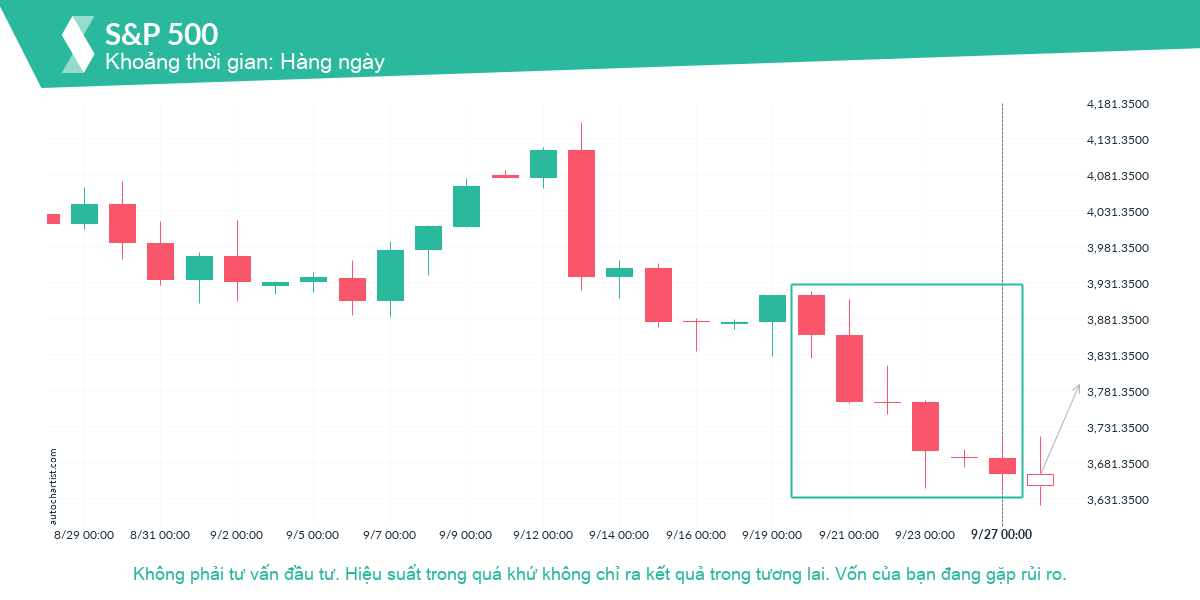
Đối với những người không tin vào xu hướng, điều này có thể là cơ hội để tận dụng mô hình nến liên tiếp giảmđặc biệt lớn trên S&P 500. Biến động đã xảy ra trên 8 ngày gần nhất. Đối với những người đầu tư theo xu hướng trong số các bạn, bạn có thể nghĩ về việc đi theo xu hướng có
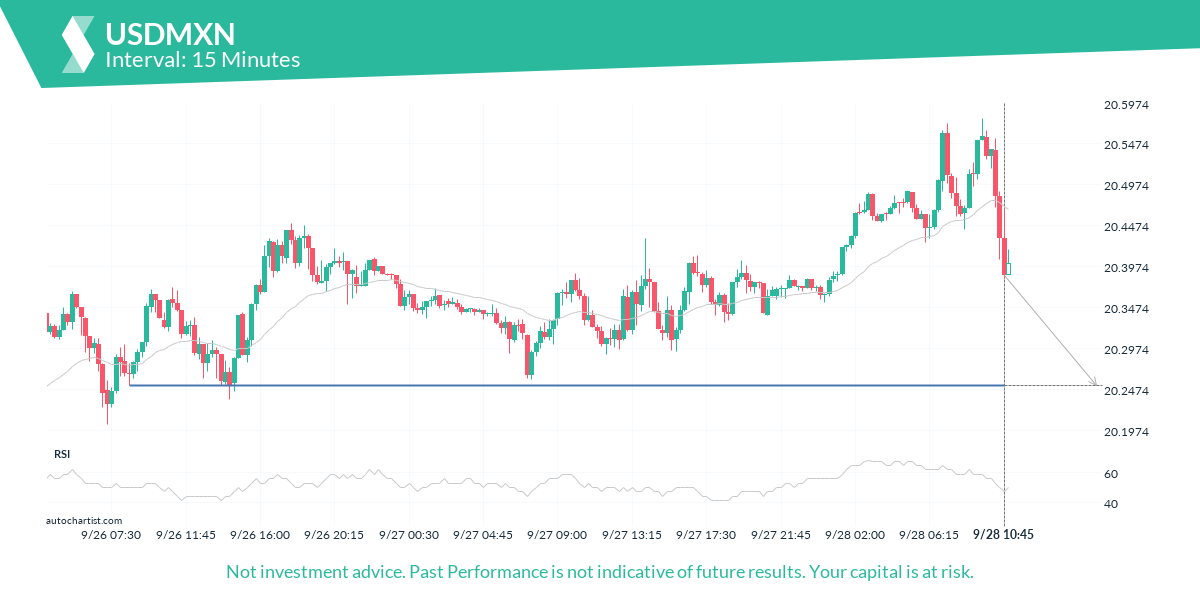
USDMXN is moving towards a line of 20.2518 which it has tested numerous times in the past. We have seen it retrace from this position in the past, so at this stage it isn’t clear whether it will breach this price or rebound as it did before. If USDMXN continues in its current trajectory, we may see it move towards 20.2518 within the next
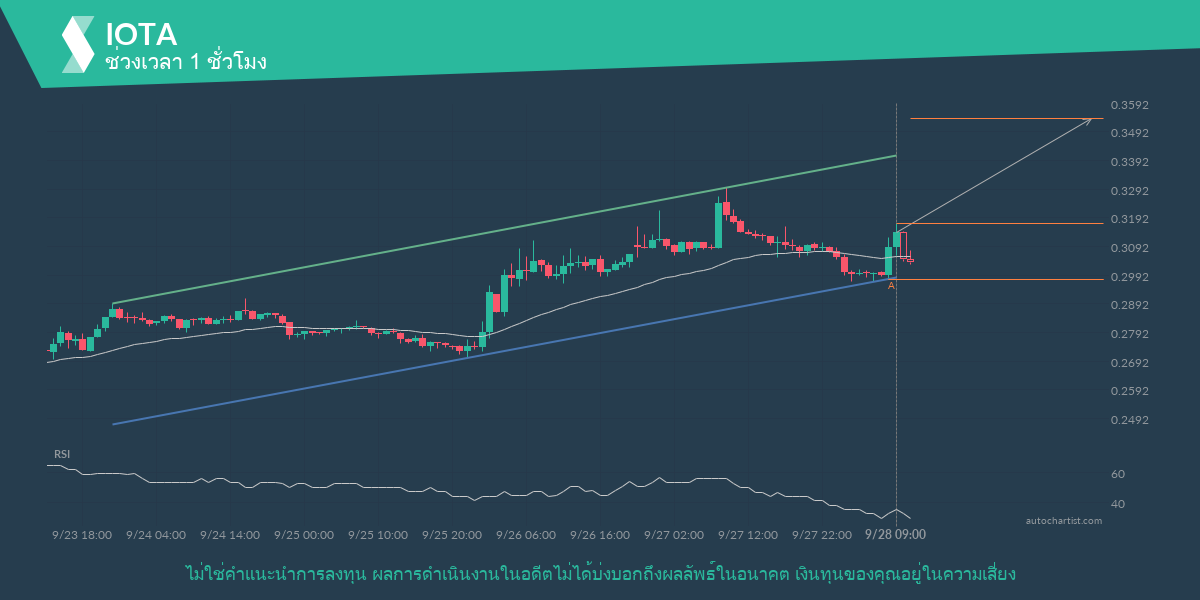
IOTA กำลังมุ่งหน้าไปยังเส้นแนวต้านของ ช่องแบบขึ้น ถ้าหากการเคลื่อนตัวนี้ยังคงเกิดขึ้นต่อไปได้ เราคาดว่าจะเห็นราคาของ IOTA ไปทดสอบที่ 0.3539 ภายในช่วง 2 วันถัดไป แต่อย่าพึ่งรีบทำการเทรด ราคาได้มาทดสอบเส้นนี้หลายครั้งแล้วในอดีต ดังนั้นการเคลื่อนตัวนี้อาจเกิดการรีบาวน์เหมือนที่เกิดขึ้นในอดีต
For those of you that don’t believe in trends, this may be an opportunity to take advantage of an exceptionally large amount of consecutive bearishcandles on S&P 500. The movement has happened over the last 8 days. For those trend followers among you, you may think about riding this possible trend.
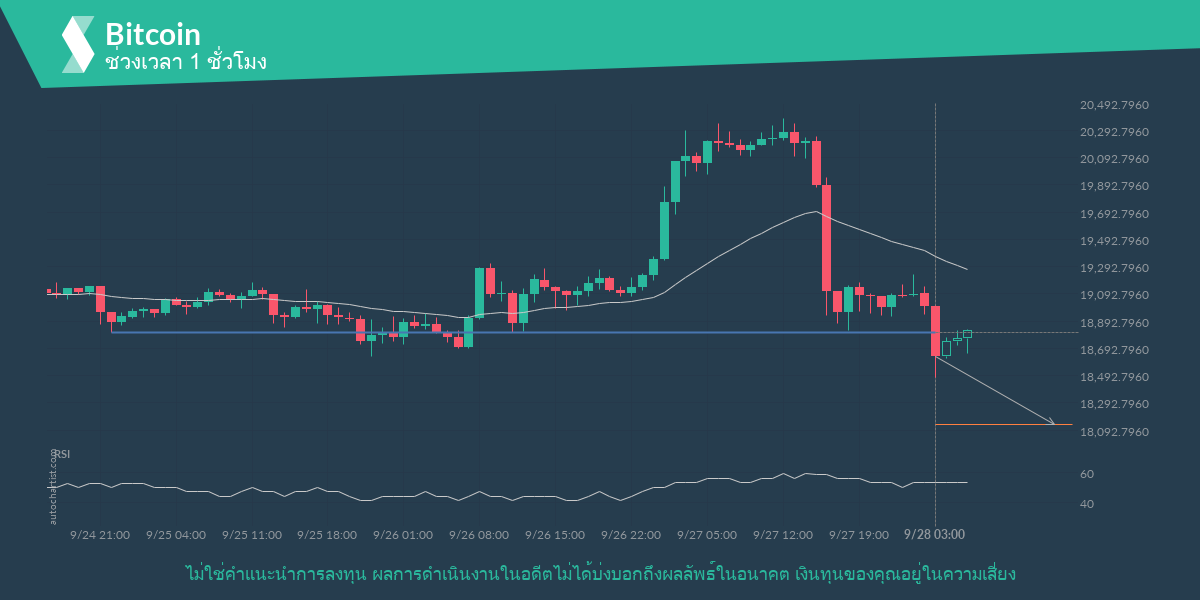
Bitcoin ได้เบรคผ่านแนวรับของ แนวรับ ราคาได้มาแตะเส้นนี้หลายครั้งแล้วในช่วง 4 วันที่ผ่านมา การเบรคนี้บอกถึงโอกาสในการเคลื่อนตัวไปยัง 18133.1094 ภายใน 15 ชั่วโมงต่อจากนี้ เนื่องจากเราได้เห็นการย่อตัวลงมาจากตำแหน่งนี้ในช่วงก่อนหน้านี้ คุณควรรอการยืนยันของการทะลุผ่าน

Norway 25 is moving towards a line of 1074.5200 which it has tested numerous times in the past. We have seen it retrace from this position in the past, so at this stage it isn’t clear whether it will breach this price or rebound as it did before. If Norway 25 continues in its current trajectory, we may see it move towards 1074.5200 within


