

GOOG – Chart Pattern – Triangle
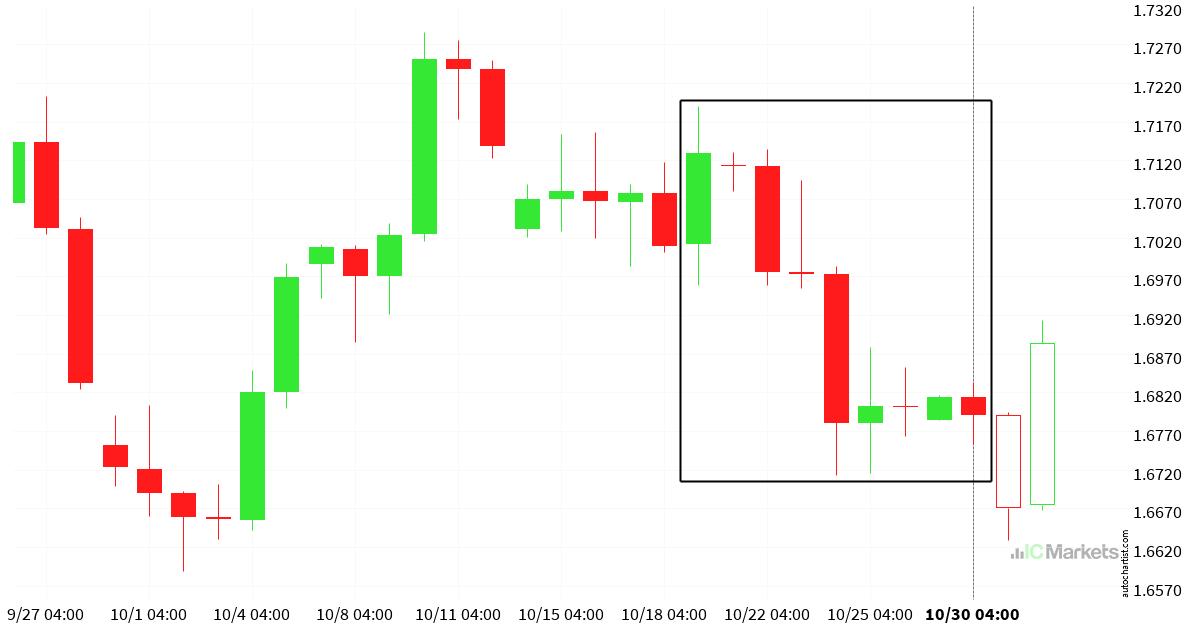
GOOG has broken through the support line of a Triangle technical chart pattern. Because it has retraced from this line in the past, you should wait for confirmation of the breakout before taking any action. It has touched this line twice in the last 16 days, which suggests a possible target around 310.5945 within the next 17 hours.
*** Risk Warning: Trading in securities involves significant risk. Prices may fluctuate and securities may become valueless. Losses may exceed deposits. These products are complex and require appropriate knowledge.
BẮT ĐẦU THỬ TÀI KHOẢN DEMO MIỄN PHÍ