


STOXX50 – Chart Pattern – Rising Wedge
STOXX50 has broken through the support line of a Rising Wedge pattern and suggests a possible move to 5689.0862 within the next 15 hours. It has tested this line before, so it is prudent to wait for confirmation of the breakout before taking action. If the breakout is not confirmed, we could see a retracement […]

NAB – Key Level – Resistance
NAB has broken through a level at 40.4850, suggesting a possible move to 40.7420 within the next 7 hours. It has tested this level numerous times in the past, so you should wait for confirmation of this breakout before taking any action. If the breakout does not confirm, we could see a retracement back to […]

WOW – Chart Pattern – Rising Wedge
An emerging Rising Wedge pattern has been detected for WOW on the 1 hour chart. There may be a move toward 29.9823 in the next few candles. Once it reaches the resistance, it may continue its bullish run or revert to current price levels. *** Risk Warning: Trading in securities involves significant risk. Prices may […]

TCL – Key Level – Resistance
TCL is about to retest a key horizontal resistance level near 15.2050. It has tested this level 3 times recently and may simply bounce off it, as it did last time. However, after so many attempts, it may be ready to start a new trend. *** Risk Warning: Trading in securities involves significant risk. Prices […]

AAPL – Chart Pattern – Channel Up
AAPL has broken through the support line, which it has tested twice before. We have seen it retrace from this line before, so wait for confirmation of the breakout before trading. If this new trend persists, a target level around 278.5902 may materialize within the next 17 hours. *** Risk Warning: Trading in securities involves […]

JP225 – Key Level – Resistance
JP225 has broken through a resistance line. Since it has previously retraced from this price, wait for confirmation of the breakout before trading. It has touched this line several times over the past 14 days. This suggests a possible target around 51153.0000 within the next 2 days. *** Risk Warning: Trading in securities involves significant […]

GOOG – Chart Pattern – Triangle
GOOG has broken through the support line of a Triangle technical chart pattern. Because it has retraced from this line in the past, you should wait for confirmation of the breakout before taking any action. It has touched this line twice in the last 16 days, which suggests a possible target around 310.5945 within the […]

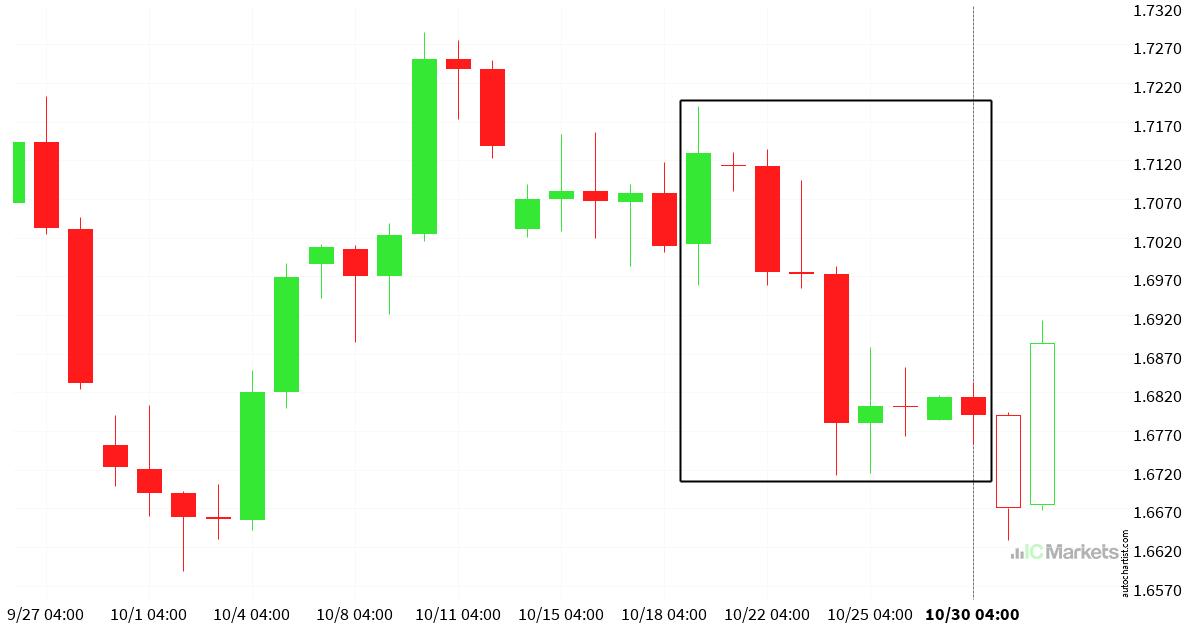
AUDJPY – Key Level – Support
AUDJPY is approaching the line at 101.7565. If this move continues, the price of AUDJPY could test 101.7565 within the next 3 days. But do not rush to trade. It has tested this line many times in the past, so the move could be short-lived and end in a rebound. *** Risk Warning: Trading in […]

IT40 – Chart Pattern – Rising Wedge
IT40 has moved through the support line of a Rising Wedge pattern at 43390.529411764706 on the 4 hour chart. This line has been tested multiple times in the past, and this breakout could signal an upcoming change in the current trend. Price may continue in the current direction toward 43055.4123. *** Risk Warning: Trading in […]
USTEC – Key Level – Resistance
USTEC has broken through a resistance line. Since it has previously retraced from this price, wait for confirmation of the breakout before trading. It has touched this line several times over the past 2 days. This suggests a possible target around 25711.9043 within the next 9 hours. *** Risk Warning: Trading in securities involves significant […]