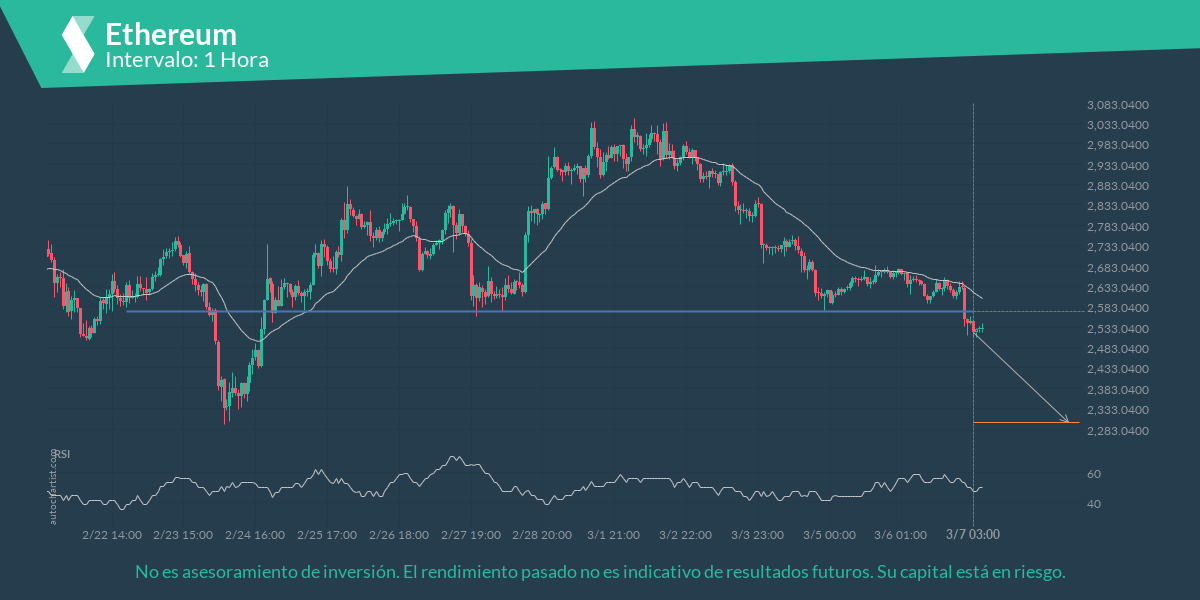
La rotura del Ethereum a través de la línea de precio en 2570.3999 es una brecha de un importante precio psicológico que se ha probado numerosas veces en el pasado. Si esta rotura persiste, el Ethereum podría probar el nivel de 2298.0750 durante las siguientes 3 días. Habría que ser prudentes antes de ejecutar una orden y esperar a la confirmación de la ruptura.
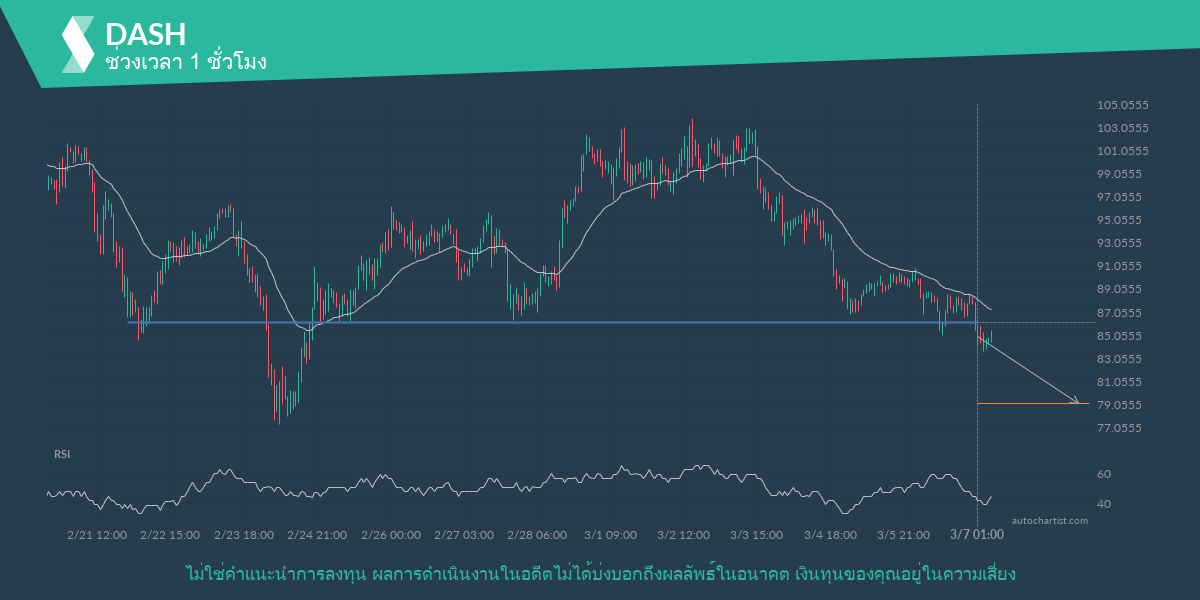
DASH ได้เบรคผ่านแนวรับของ แนวรับ ราคาได้มาแตะเส้นนี้หลายครั้งแล้วในช่วง 14 วันที่ผ่านมา การเบรคนี้บอกถึงโอกาสในการเคลื่อนตัวไปยัง 79.0380 ภายใน 4 วันต่อจากนี้ เนื่องจากเราได้เห็นการย่อตัวลงมาจากตำแหน่งนี้ในช่วงก่อนหน้านี้ คุณควรรอการยืนยันของการทะลุผ่าน
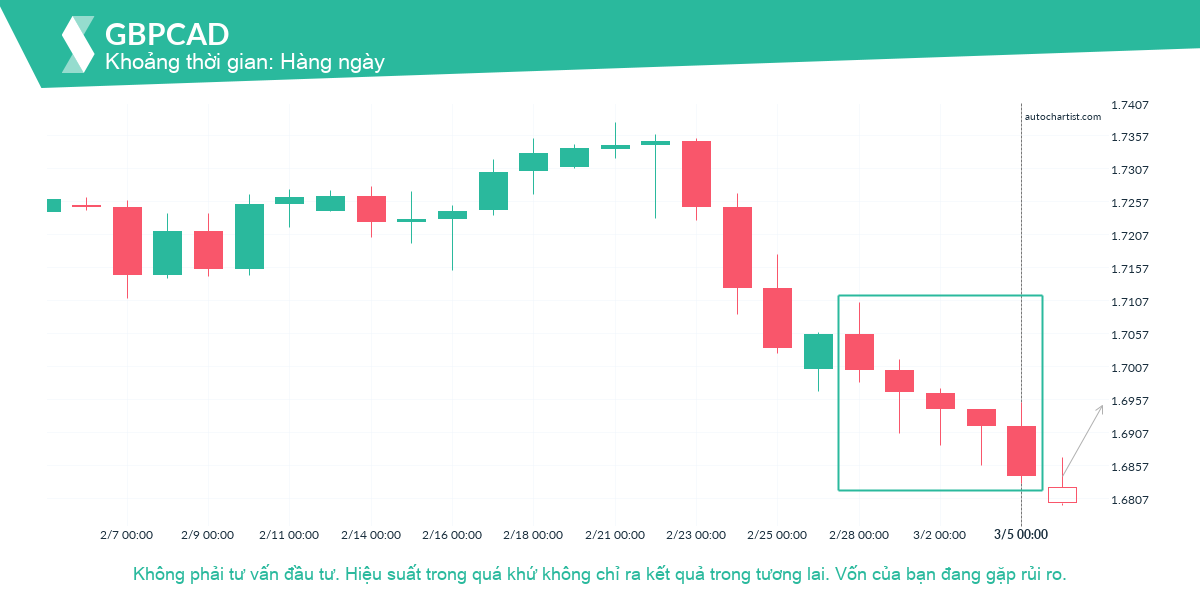
GBPCAD đã trải qua một lượng rất lớn nến giảm liên tiếp để chạm mức giá 1.6840 trong 6 ngày qua.

S&P 500 telah menembusi garis 4279.1001. Jika pecahan ini benar, kita boleh melihat harga S&P 500 menuju kepada 4223.3398 dalam 2 hari. Tetapi jangan terlalu cepat untuk berdagang, ia telah menguji garis ini beberapa kali pada masa lalu, jadi anda mungkin perlu mengesahkan pelepasan sebelum meletakkan sebarang dagangan.

El GBPCAD ha experimentado un excepcional número de velas consecutivas bajistas, alcanzando el precio de 1.6840 en los últimos 6 días.
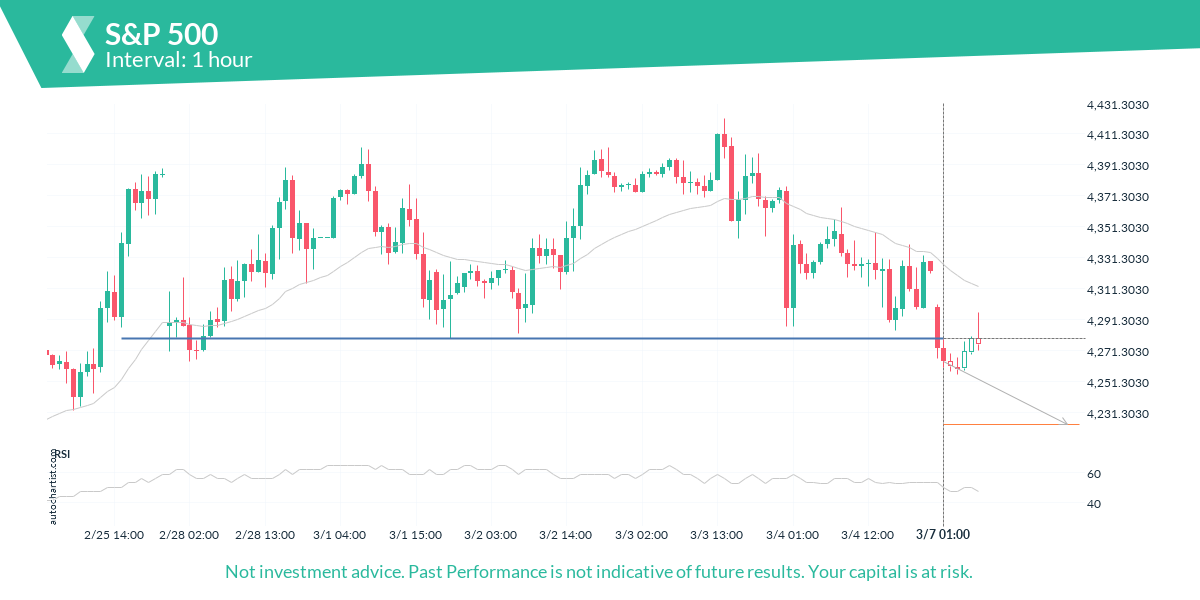
S&P 500 has broken through a line of 4279.1001. If this breakout holds true, we could see the price of S&P 500 heading towards 4223.3398 within the next 2 days. But don’t be so quick to trade, it has tested this line numerous times in the past, so you should probably confirmation the breakout before placing any trades.
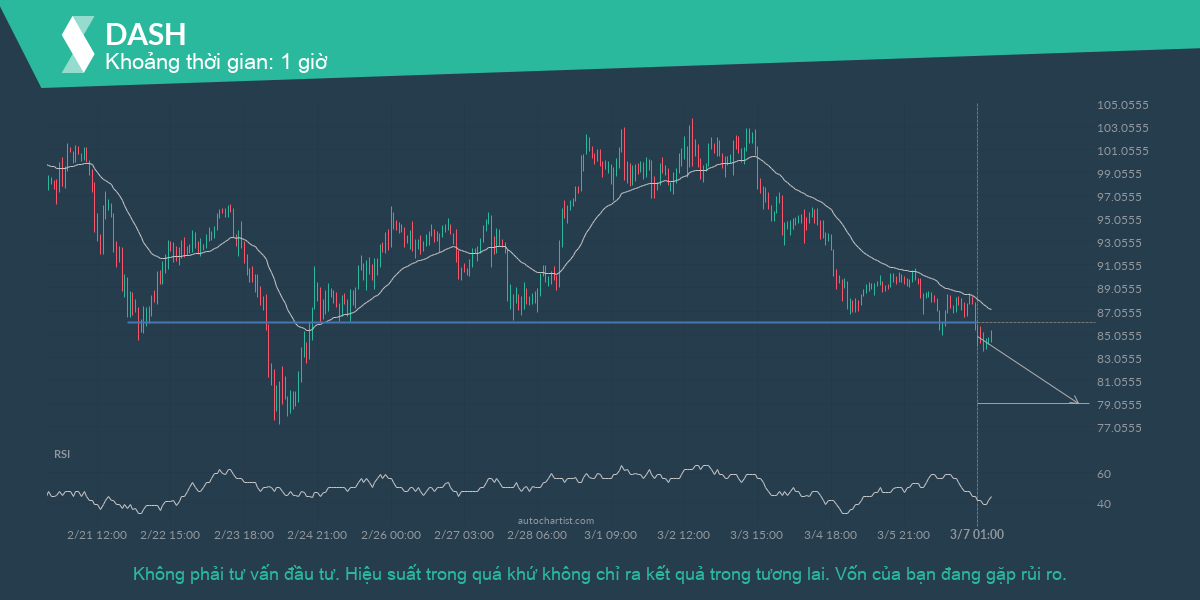
DASH đã phá vỡ đường hỗ trợ. Nó đã chạm đường này nhiều lần trong 14 ngày gần nhất. Sự bứt ra này cho thấy khả năng di chuyển tới mức 79.0380 trong 4 ngày tiếp theo. Vì chúng ta đã chứng kiến nó thoái lui khỏi mức này trong quá khứ, nhà giao dịch nên đợi xác nhận sự bứt ra.
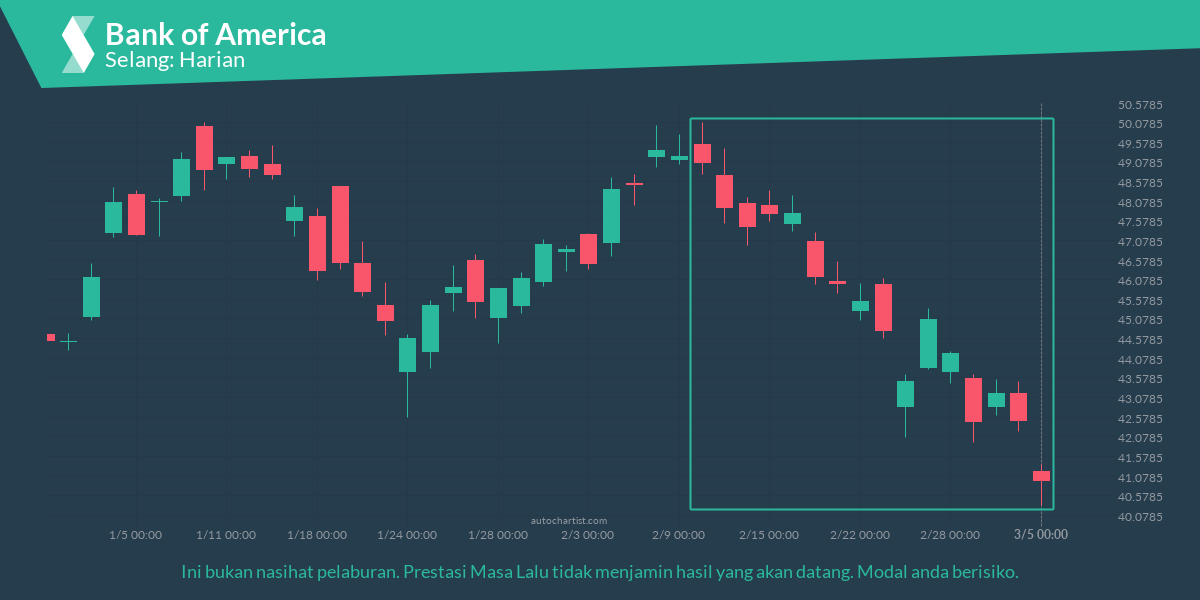
Pergerakan sebanyak 16.53% melebihi 24 hari pada Bank of America tidak disedari. Anda boleh mula pertimbangkan ke mana arah seterusnya, penerusan arah trend menurun atau pembalikan dalam arah sebelumnya.

GBPCAD has experienced an exceptionally large amount of consecutive bearish candles to reach a price of 1.6840 in the last 6 days.
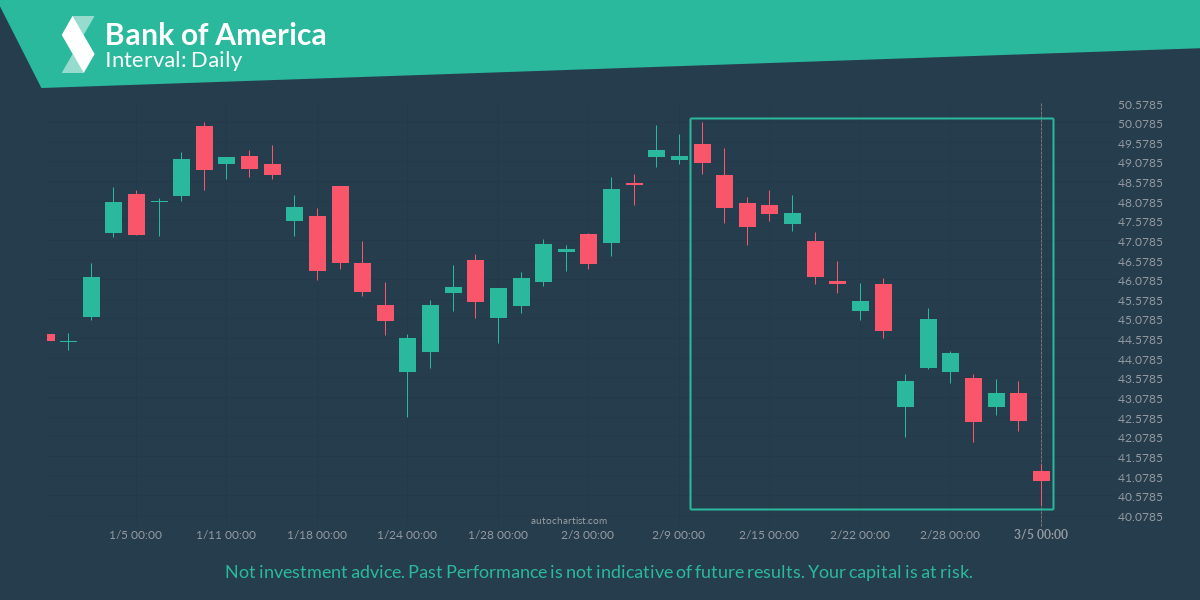
A movement of 16.53% over 24 days on Bank of America doesn’t go unnoticed. You may start considering where it’s heading next, a continuation of the current downward trend, or a reversal in the previous direction.


