

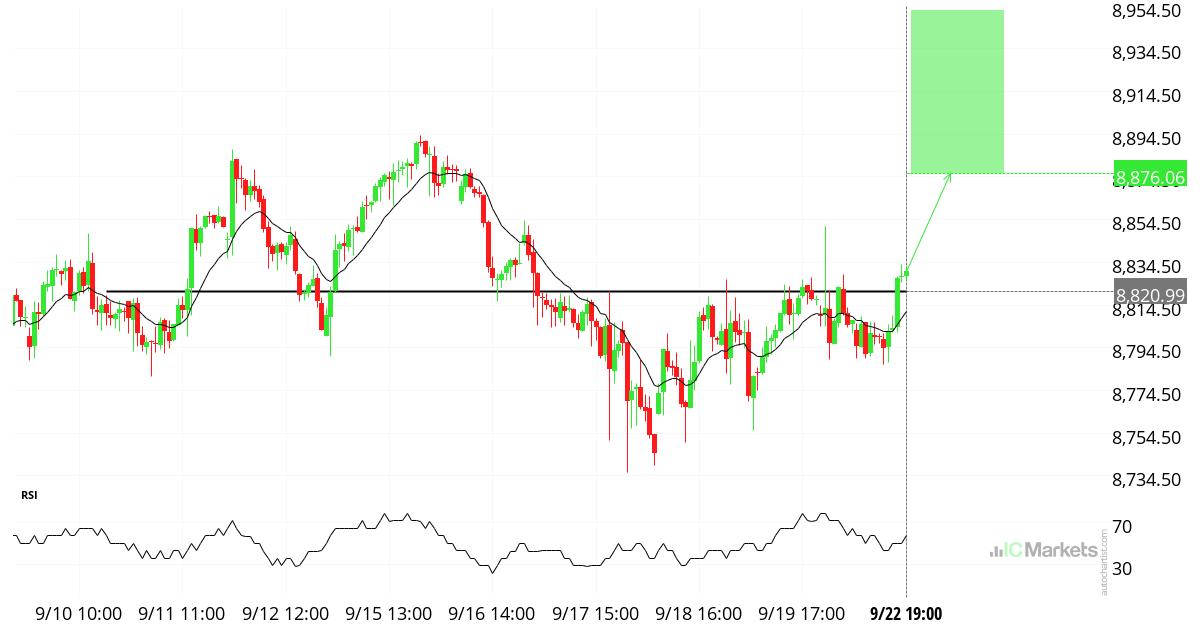
Australia 200 Index – المستوى الرئيسي – المقاومة
اخترق السعر مستوى المقاومة عند 8,820.99 في 9/22 19:00. توقعات بحركة سعرية صعودية محتملة خلال الـ 1 يوم القادمة نحو 8,876.06. تحذير من المخاطر: ينطوي التداول في الأوراق المالية على مخاطر كبيرة. قد تتقلب الأسعار وقد تفقد الأوراق المالية قيمتها بالكامل. قد تتجاوز الخسائر قيمة الودائع. هذه المنتجات معقدة وتتطلب معرفة مناسبة.

UK 100 Index – نموذج الرسم البياني – القناة الهابطة
اخترق القناة الهابطة خط المقاومة في 9/22 18:00. من المتوقع حدوث حركة سعرية صعودية خلال الـ 8 ساعات القادمة نحو 9,265.8. تحذير من المخاطر: ينطوي التداول في الأوراق المالية على مخاطر كبيرة. قد تتقلب الأسعار وقد تفقد الأوراق المالية قيمتها بالكامل. قد تتجاوز الخسائر قيمة الودائع. هذه المنتجات معقدة وتتطلب معرفة مناسبة.
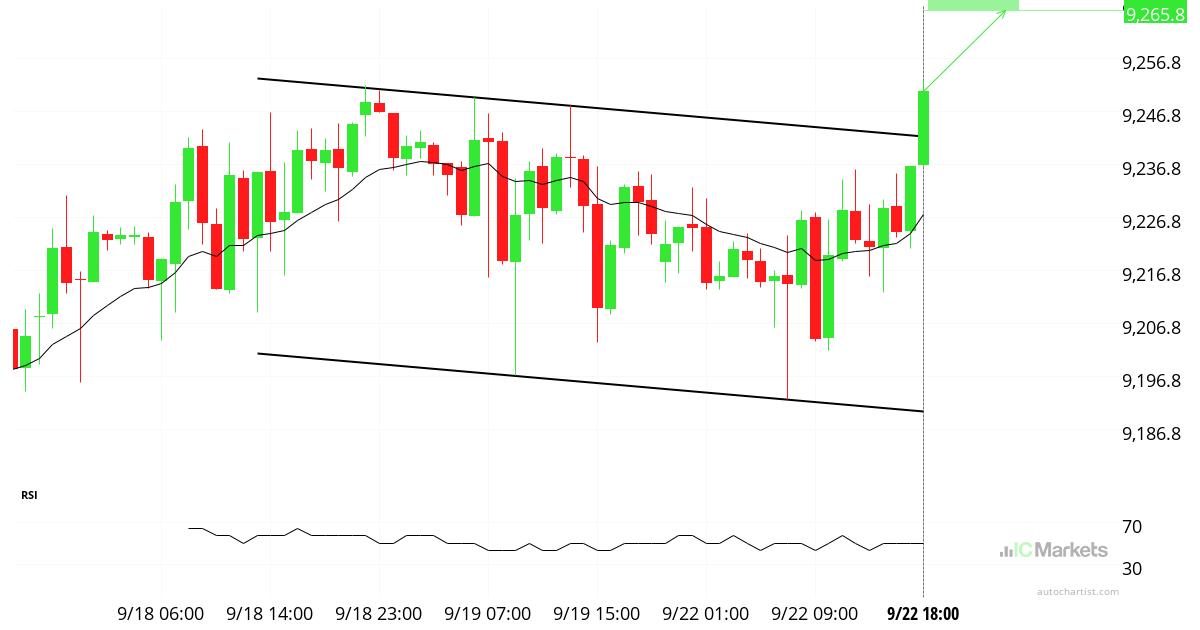
UK 100 Index – รูปแบบกราฟ – ช่องแบบลง
ช่องแบบลง ได้ทะลุแนวต้านที่ 9/22 18:00 คาดการณ์ว่าราคาอาจเคลื่อนไหวเป็นขาขึ้นในช่วง 9 ชั่วโมง ถัดไปไปทาง 9,265.8 การซื้อขายหลักทรัพย์มีความเสี่ยงสูง ราคาหลักทรัพย์อาจมีความผันผวนและอาจสูญเสียมูลค่าได้ นักลงทุนอาจสูญเสียเงินลงทุนเกินกว่าที่ฝากไว้ ผลิตภัณฑ์เหล่านี้มีความซับซ้อนและต้องใช้ความรู้ความเข้าใจอย่างเหมาะสมก่อนการลงทุน
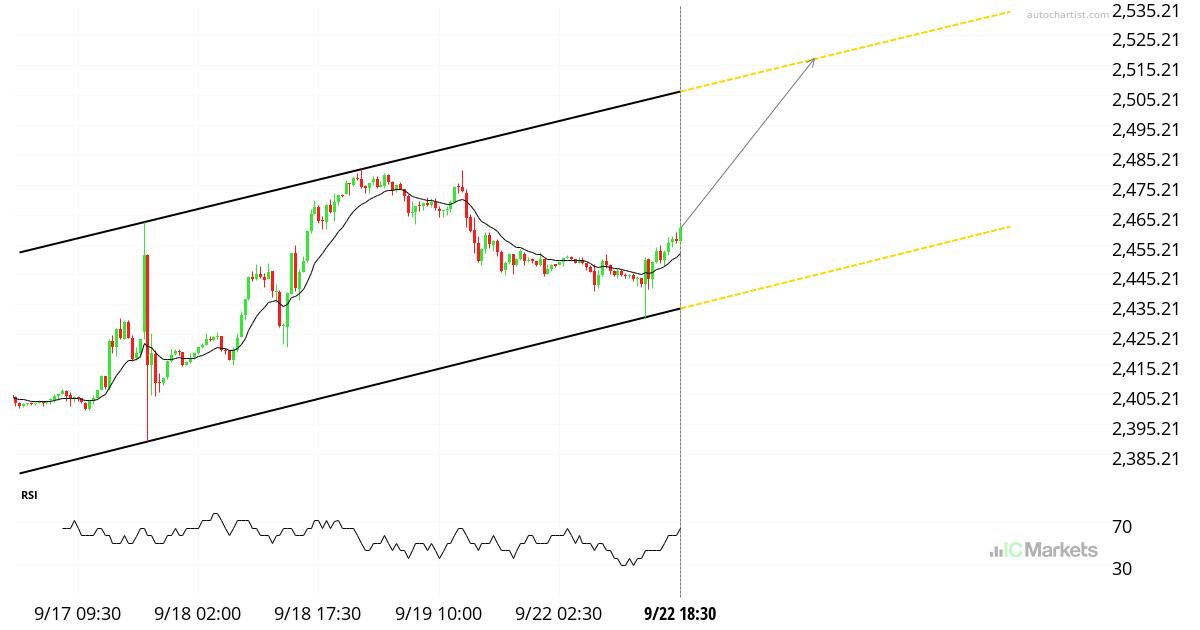
US Small Cap 2000 Index – รูปแบบกราฟ – ช่องแบบขึ้น
ช่องแบบขึ้น ถูกระบุที่ 9/22 18:30 รูปแบบนี้กำลังอยู่ระหว่างกระบวนการสร้างตัว การเคลื่อนไหวของราคาแบบกระทิงที่อาจเกิดขึ้นได้ไปยังแนวต้าน 2,517.50 ภายใน 22 ชั่วโมง ถัดไป การซื้อขายหลักทรัพย์มีความเสี่ยงสูง ราคาหลักทรัพย์อาจมีความผันผวนและอาจสูญเสียมูลค่าได้ นักลงทุนอาจสูญเสียเงินลงทุนเกินกว่าที่ฝากไว้ ผลิตภัณฑ์เหล่านี้มีความซับซ้อนและต้องใช้ความรู้ความเข้าใจอย่างเหมาะสมก่อนการลงทุน

US Small Cap 2000 Index – نموذج الرسم البياني – القناة الصاعدة
تم تحديد القناة الصاعدة في 9/22 18:30. لا يزال هذا النمط قيد التشكّل. توقعات بحركة سعرية صعودية محتملة نحو مستوى المقاومة 2,517.50 خلال الـ 22 ساعات القادمة. تحذير من المخاطر: ينطوي التداول في الأوراق المالية على مخاطر كبيرة. قد تتقلب الأسعار وقد تفقد الأوراق المالية قيمتها بالكامل. قد تتجاوز الخسائر قيمة الودائع. هذه المنتجات معقدة […]

Euro vs US Dollar – ระดับสำคัญ – แนวต้าน
กำลังเคลื่อนไปที่ระดับ แนวต้าน ของ 1.1853 ตรวจพบที่ 9/22 18:00 รูปแบบนี้กำลังอยู่ระหว่างการฟอร์มตัว มีโอกาสเกิดการเคลื่อนตัวของราคาแบบ bullish ไปยังแนวต้าน 1.1853 ภายใน 23 ชั่วโมง ต่อจากนี้ การซื้อขายหลักทรัพย์มีความเสี่ยงสูง ราคาหลักทรัพย์อาจมีความผันผวนและอาจสูญเสียมูลค่าได้ นักลงทุนอาจสูญเสียเงินลงทุนเกินกว่าที่ฝากไว้ ผลิตภัณฑ์เหล่านี้มีความซับซ้อนและต้องใช้ความรู้ความเข้าใจอย่างเหมาะสมก่อนการลงทุน
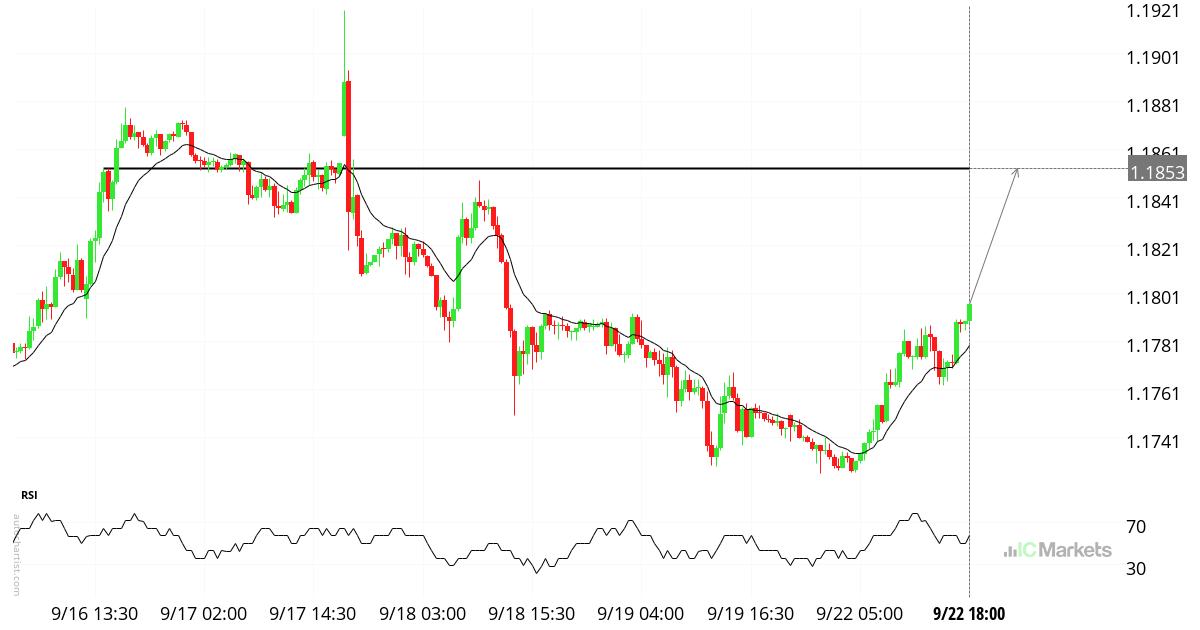
Euro vs US Dollar – المستوى الرئيسي – المقاومة
يقترب من مستوى المقاومة عند 1.1853 المحدد في 9/22 18:00. لا يزال هذا النمط قيد التشكّل. توقعات بحركة سعرية صعودية محتملة نحو مستوى المقاومة 1.1853 خلال الـ 23 ساعات القادمة. تحذير من المخاطر: ينطوي التداول في الأوراق المالية على مخاطر كبيرة. قد تتقلب الأسعار وقد تفقد الأوراق المالية قيمتها بالكامل. قد تتجاوز الخسائر قيمة الودائع. […]
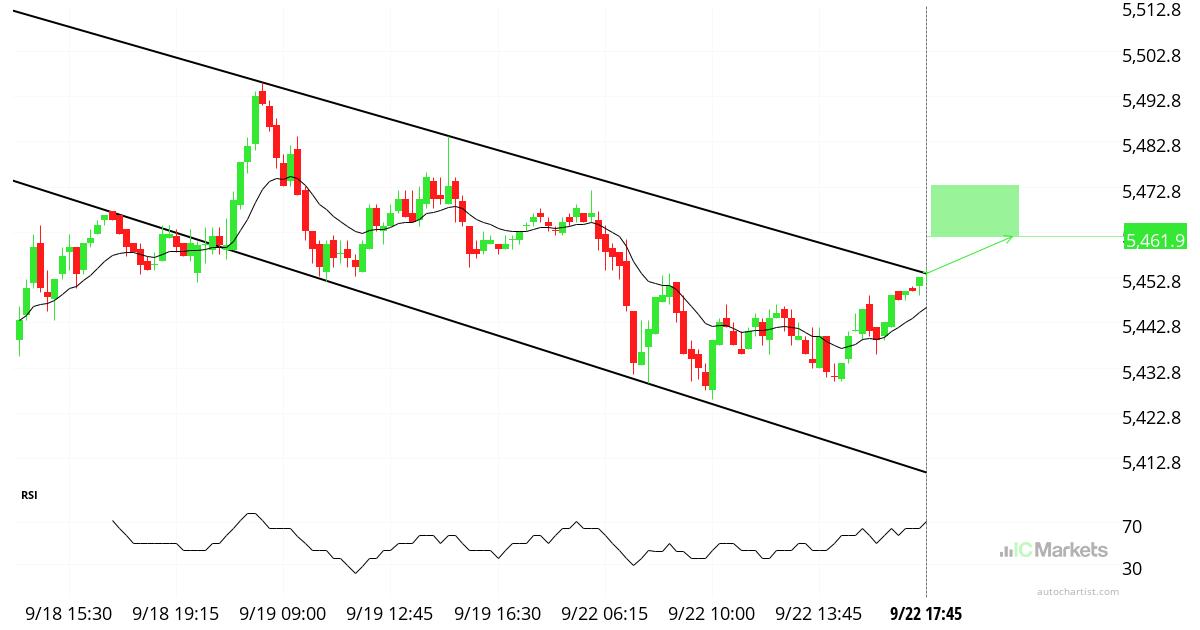
EU Stocks 50 Index – รูปแบบกราฟ – ช่องแบบลง
ช่องแบบลง ได้ทะลุแนวต้านที่ 9/22 17:45 คาดการณ์ว่าราคาอาจเคลื่อนไหวเป็นขาขึ้นในช่วง 7 ชั่วโมง ถัดไปไปทาง 5,461.9 การซื้อขายหลักทรัพย์มีความเสี่ยงสูง ราคาหลักทรัพย์อาจมีความผันผวนและอาจสูญเสียมูลค่าได้ นักลงทุนอาจสูญเสียเงินลงทุนเกินกว่าที่ฝากไว้ ผลิตภัณฑ์เหล่านี้มีความซับซ้อนและต้องใช้ความรู้ความเข้าใจอย่างเหมาะสมก่อนการลงทุน

US Small Cap 2000 Index – نموذج الرسم البياني – القناة الصاعدة
تم تحديد القناة الصاعدة في 9/22 17:45. لا يزال هذا النمط قيد التشكّل. توقعات بحركة سعرية صعودية محتملة نحو مستوى المقاومة 2,517.10 خلال الـ 22 ساعات القادمة. تحذير من المخاطر: ينطوي التداول في الأوراق المالية على مخاطر كبيرة. قد تتقلب الأسعار وقد تفقد الأوراق المالية قيمتها بالكامل. قد تتجاوز الخسائر قيمة الودائع. هذه المنتجات معقدة […]
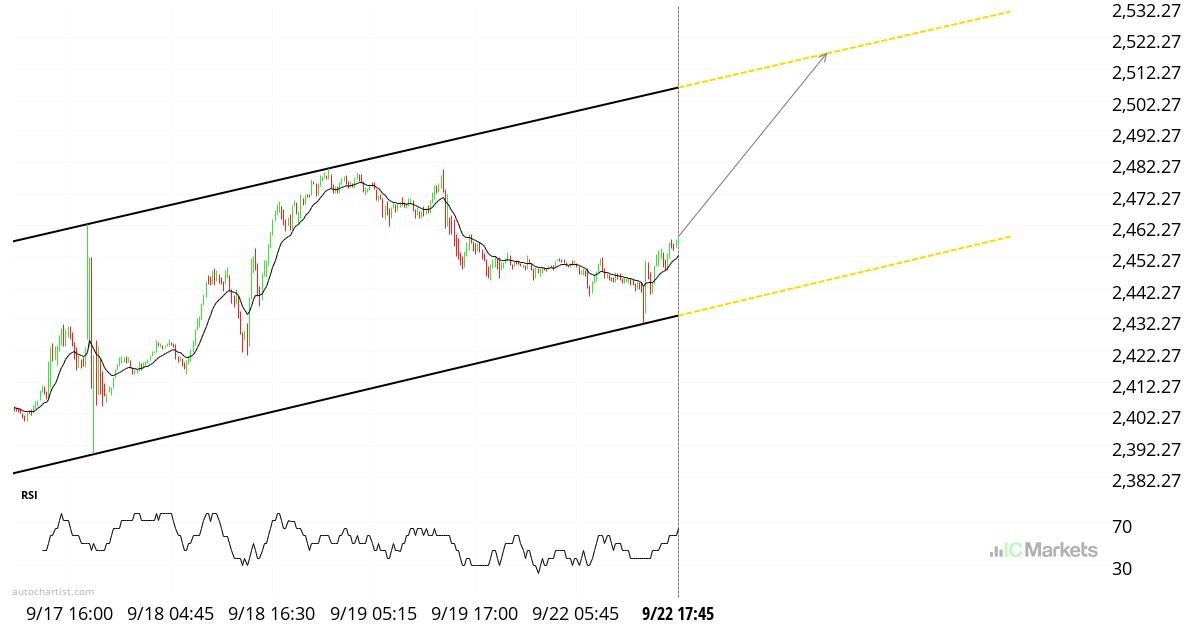
US Small Cap 2000 Index – รูปแบบกราฟ – ช่องแบบขึ้น
ช่องแบบขึ้น ถูกระบุที่ 9/22 17:45 รูปแบบนี้กำลังอยู่ระหว่างกระบวนการสร้างตัว การเคลื่อนไหวของราคาแบบกระทิงที่อาจเกิดขึ้นได้ไปยังแนวต้าน 2,517.10 ภายใน 22 ชั่วโมง ถัดไป การซื้อขายหลักทรัพย์มีความเสี่ยงสูง ราคาหลักทรัพย์อาจมีความผันผวนและอาจสูญเสียมูลค่าได้ นักลงทุนอาจสูญเสียเงินลงทุนเกินกว่าที่ฝากไว้ ผลิตภัณฑ์เหล่านี้มีความซับซ้อนและต้องใช้ความรู้ความเข้าใจอย่างเหมาะสมก่อนการลงทุน