

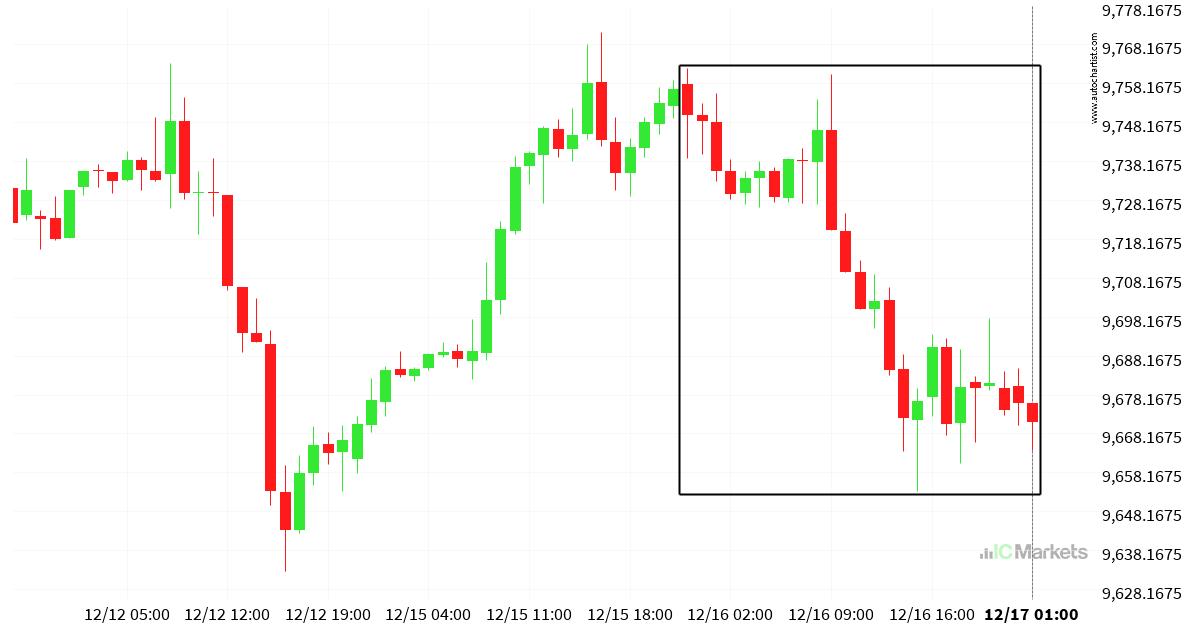
UK100 – Big Movement
UK100 experienced an unusually large move lasting 2. This ranks in the 99.0 percentile and is considered uncommon based on recent price data. *** Risk Warning: Trading in securities involves significant risk. Prices may fluctuate and securities may become valueless. Losses may exceed deposits. These products are complex and require appropriate knowledge.
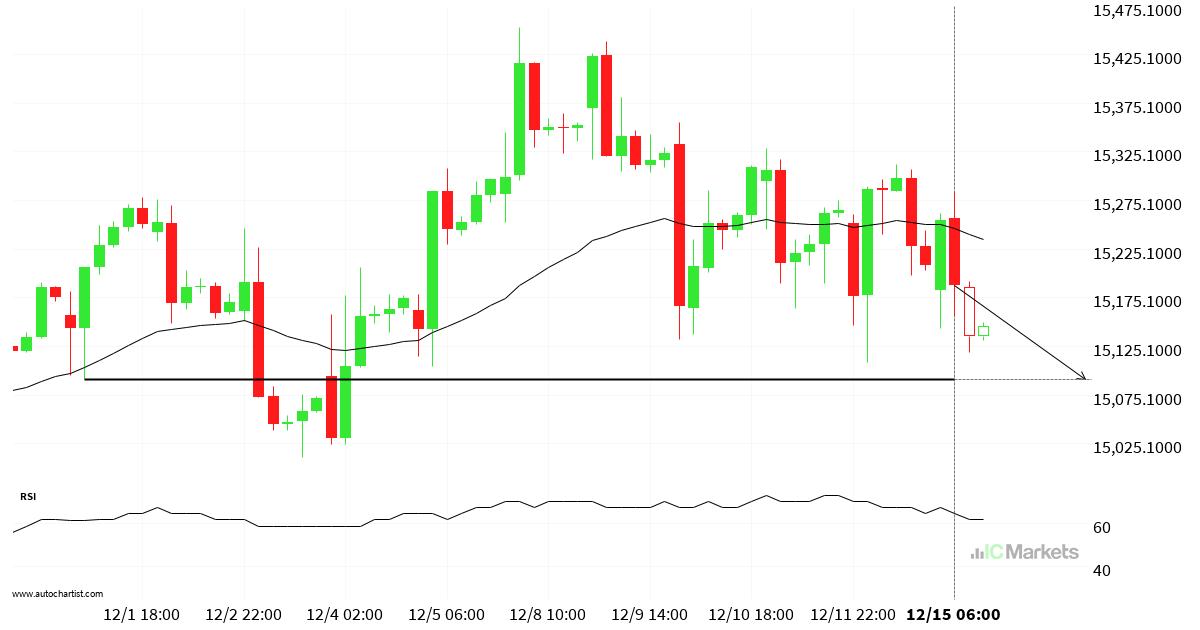
CHINA50 – Key Levels – Support
CHINA50 is about to retest a key horizontal support level near 15091.0000. It has tested this level 3 times recently and may simply bounce off it, as it did last time. However, after so many attempts, it may be ready to start a new trend. *** Risk Warning: Trading in securities involves significant risk. Prices […]
WBC – الشموع المتتالية
سجّل WBC عددًا غيرَ معتادٍ من الشموعِ الصاعدةِ على الإطارِ الزمنيّ 4 ساعة . تحذير من المخاطر: ينطوي التداول في الأوراق المالية على مخاطر كبيرة. قد تتقلب الأسعار وقد تفقد الأوراق المالية قيمتها بالكامل. قد تتجاوز الخسائر قيمة الودائع. هذه المنتجات معقدة وتتطلب معرفة مناسبة.

WBC – Velas consecutivas
WBC registró un número inusual de velas alcistas en el marco temporal 4 Hora. *** Risk Warning: Trading in securities involves significant risk. Prices may fluctuate and securities may become valueless. Losses may exceed deposits. These products are complex and require appropriate knowledge.

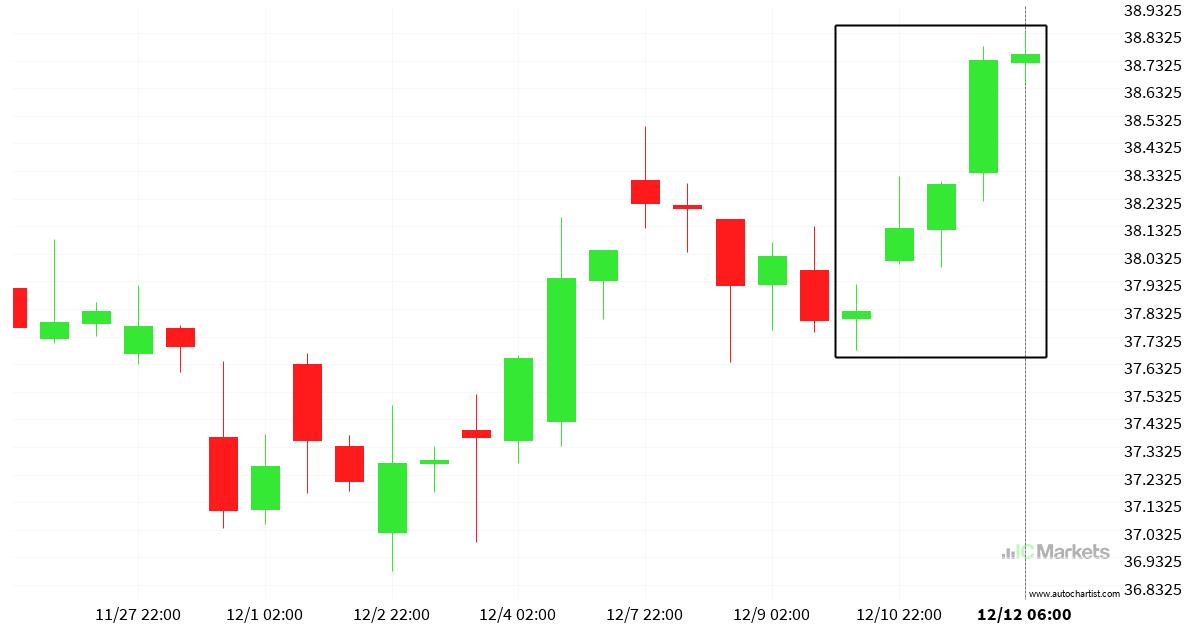
WBC – Consecutive Candle
WBC experienced an unusual number of bullish candles on the 4 hour timeframe. *** Risk Warning: Trading in securities involves significant risk. Prices may fluctuate and securities may become valueless. Losses may exceed deposits. These products are complex and require appropriate knowledge.

WBC – Consecutive Candles
WBC มีแท่งเทียน ขาขึ้น ที่ผิดปกติในกรอบเวลา 4 ชั่วโมง การซื้อขายหลักทรัพย์มีความเสี่ยงสูง ราคาหลักทรัพย์อาจมีความผันผวนและอาจสูญเสียมูลค่าได้ นักลงทุนอาจสูญเสียเงินลงทุนเกินกว่าที่ฝากไว้ ผลิตภัณฑ์เหล่านี้มีความซับซ้อนและต้องใช้ความรู้ความเข้าใจอย่างเหมาะสมก่อนการลงทุน
SUN – Chart Patterns – ช่องแบบขึ้น
SUN กำลังก่อตัวเป็นรูปแบบ ช่องแบบขึ้น ซึ่งบ่งชี้ว่าเบรกเอาต์อาจใกล้เกิดขึ้น นี่เป็นรูปแบบกราฟที่เหมาะกับสวิงเทรดเดอร์และเทรดเดอร์ตามเทรนด์ ขณะนี้กำลังเข้าใกล้เส้น แนวรับ ที่เคยทดสอบมาก่อน ผู้ที่มองหาโอกาสจาก divergence อาจมองบวกว่า มีโอกาสเกิดเบรกเอาต์และเป็นจุดเริ่มต้นของแนวโน้มใหม่ นอกจากนี้ การเกิด convergence อาจเป็นสัญญาณสำหรับสวิงเทรดเดอร์ที่มองหาการเด้งกลับ ไม่ว่าจะอย่างไร เราคาดว่าราคามีแนวโน้มเคลื่อนตัวไปยัง 17.3821 ในอีกไม่นาน การซื้อขายหลักทรัพย์มีความเสี่ยงสูง ราคาหลักทรัพย์อาจมีความผันผวนและอาจสูญเสียมูลค่าได้ นักลงทุนอาจสูญเสียเงินลงทุนเกินกว่าที่ฝากไว้ ผลิตภัณฑ์เหล่านี้มีความซับซ้อนและต้องใช้ความรู้ความเข้าใจอย่างเหมาะสมก่อนการลงทุน
SUN – النماذج السعرية – اتجاه صاعد
SUN محاصر داخل اتجاه صاعد ، مما يعطي إشارة إلى أن الاختراق وشيك. تمثل هذه فرصة تداول رائعة لمتداولي الاتجاه والسوينغ. يقترب السعر حاليًا من خط الدعم الذي سبق اختباره. يبدو متداولو الدايفرجنس متفائلين للغاية بشأن اختراق محتمل قد يكون بداية لاتجاه جديد. قد يتيح عامل التقارب أيضًا فرصة رائعة لمتداولي السوينغ الذين يبحثون عن […]

SUN – Figuras Gráficas – Canal alcista
SUN se encuentra atrapado en una formación de Canal alcista, lo que sugiere que una ruptura es inminente. Es una excelente configuración operativa tanto para los operadores de tendencia como para los de swing. Ahora se aproxima a una línea de soporte que ya se ha puesto a prueba en el pasado. Quienes operan divergencias […]

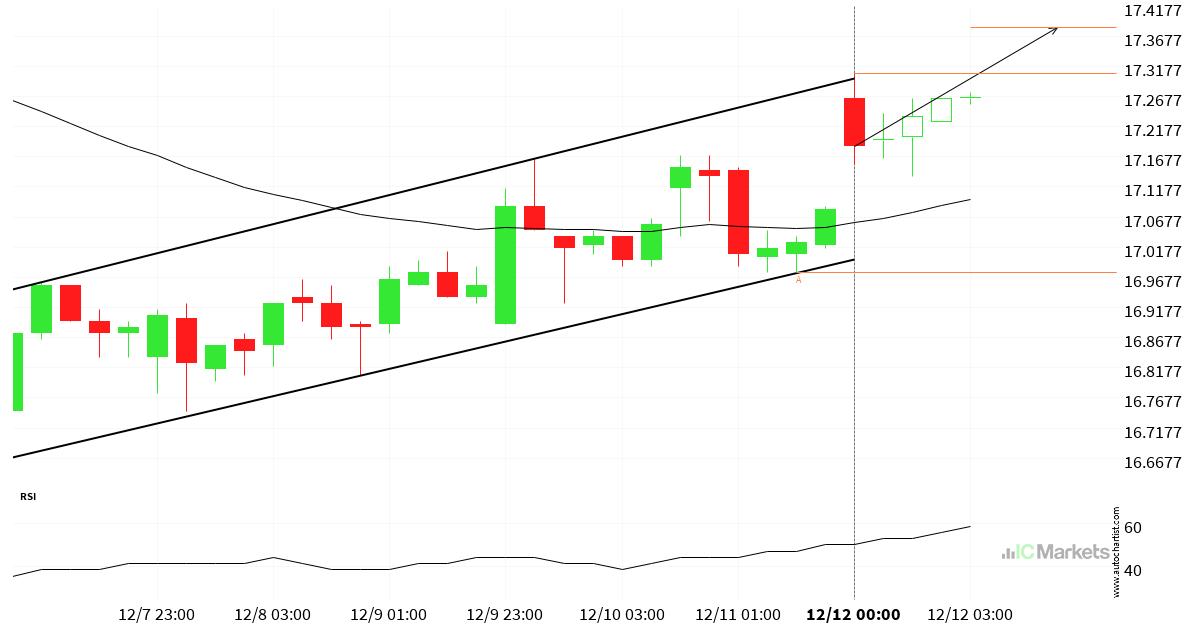
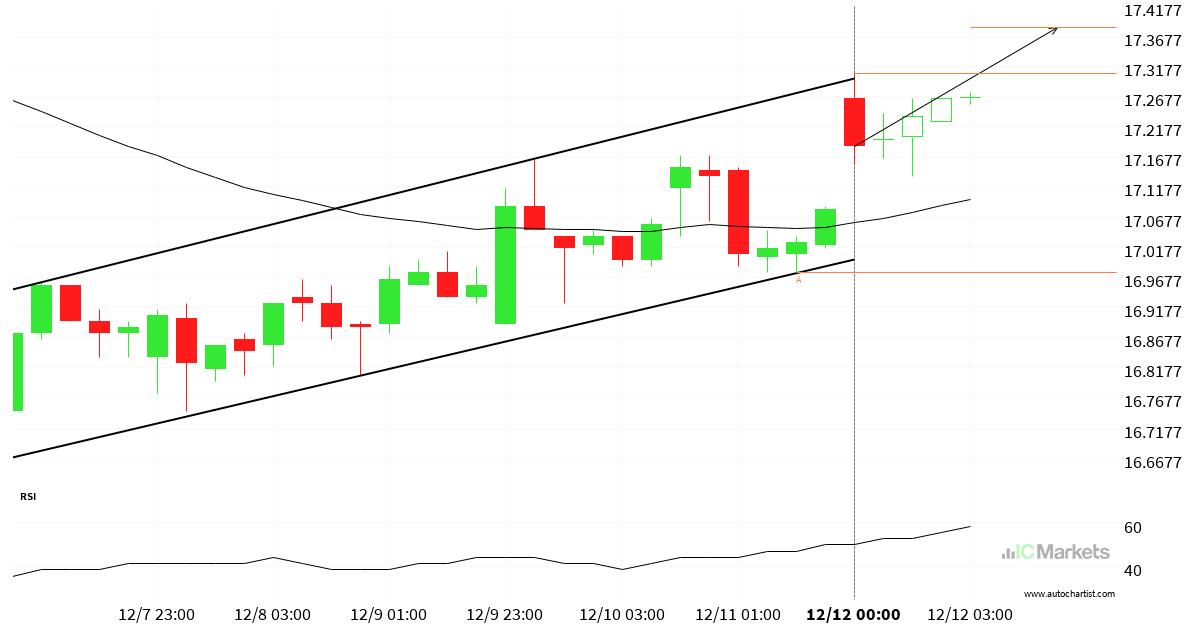
SUN – Chart Patterns – Channel Up
A Channel Up pattern was identified for SUN at 17.305, suggesting it may move toward the resistance line at 17.3821. It may break through that line and continue the bullish trend, or reverse from it. *** Risk Warning: Trading in securities involves significant risk. Prices may fluctuate and securities may become valueless. Losses may exceed […]