

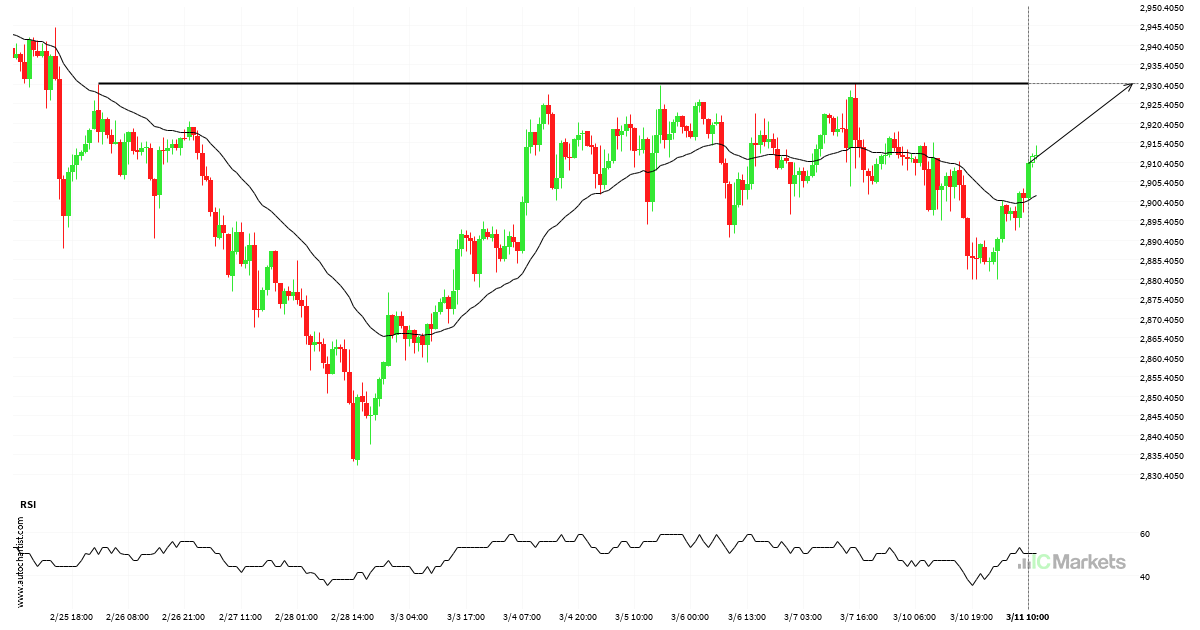
Un posible impulso final en el GOLD
El precio de GOLD ha vuelto a la zona de resistencia. Es posible que tenga dificultades para atravesarla y que retroceda en la otra dirección. El precio eventualmente puede romper, pero normalmente el precio rebota en el nivel varias veces antes de hacerlo.
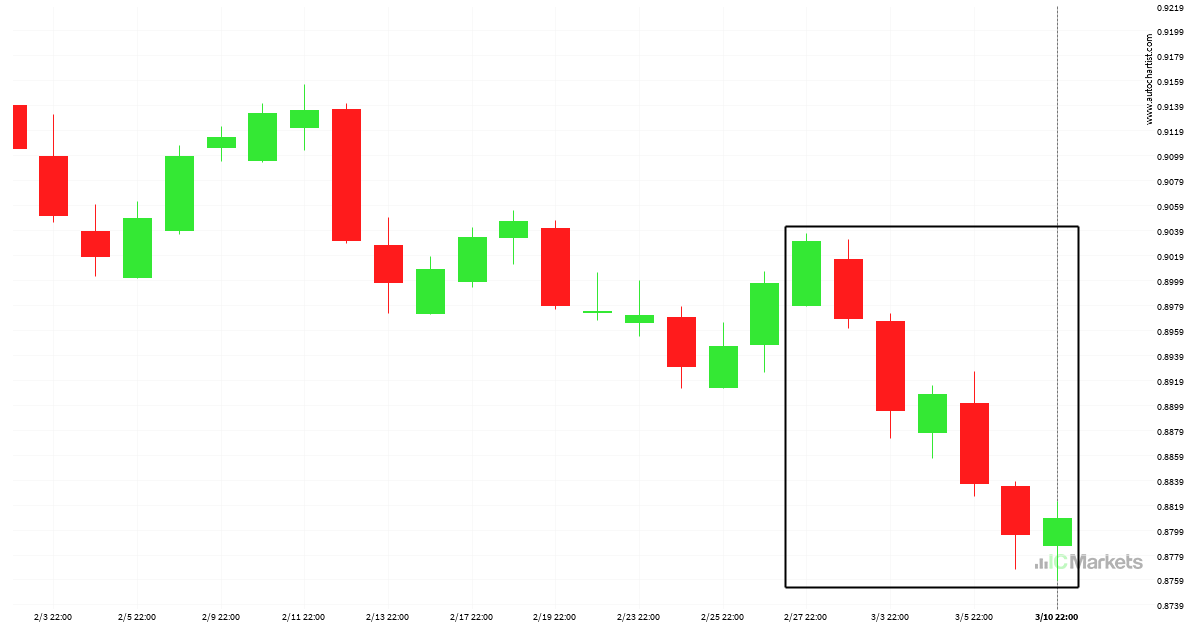
USDCHF กำลังเคลื่อนตัว รีบดำเนินการในตอนนี้
USDCHF ได้เกิดการเคลื่อนไหวอย่างมีนัยสำคัญในช่วง 11 วัน ที่ผ่านมา แนวโน้มนี้อาจดำเนินต่อไปแต่นี่จะเป็นสิ่งที่ไม่เคยเกิดขึ้นมาก่อนในอดีต

การเคลื่อนไหวขนาดใหญ่มากบน Netflix Inc.
สำหรับผู้ที่ไม่เชื่อในแนวโน้ม นี่อาจเป็นโอกาสใช้ประโยชน์จากการเคลื่อนตัว 15.88% ของ Netflix Inc. การเคลื่อนตัวนี้ได้เกิดขึ้นในช่วง 23 วันที่ผ่านมา สำหรับผู้ที่กำลังติดตามแนวโน้มนี้อยู่ คุณอาจเกาะไปกับเทรนด์นี้ได้

USDCHF se está moviendo, actúe ahora
USDCHF experimentó un movimiento extremadamente grande en el último período de 11 días. Puede continuar la tendencia, pero esto haría que el movimiento no tuviera precedentes en el pasado reciente.
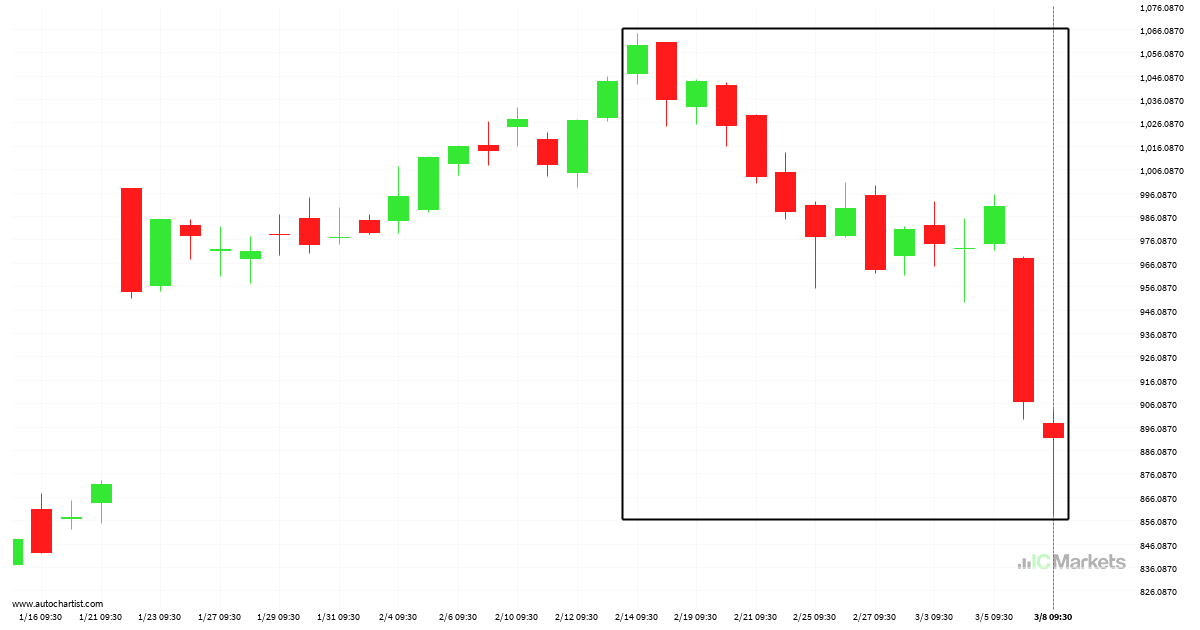
Movimiento extremo en Netflix Inc.
Para aquellos de ustedes que no creen en las tendencias, esta puede ser una oportunidad para aprovechar un excepcional movimiento de un 15,88% en Netflix Inc.. Este movimiento ha ocurrido durante los últimos 23 días. Por otro lado, para aquellos que siguen las tendencias, deben considerar aprovecharse de esta.

EURCHF Nível visado: 0.9578
Aproximando-Resistência nível de 0.9578 identificado em 11-mar-2025 04:30 UTC
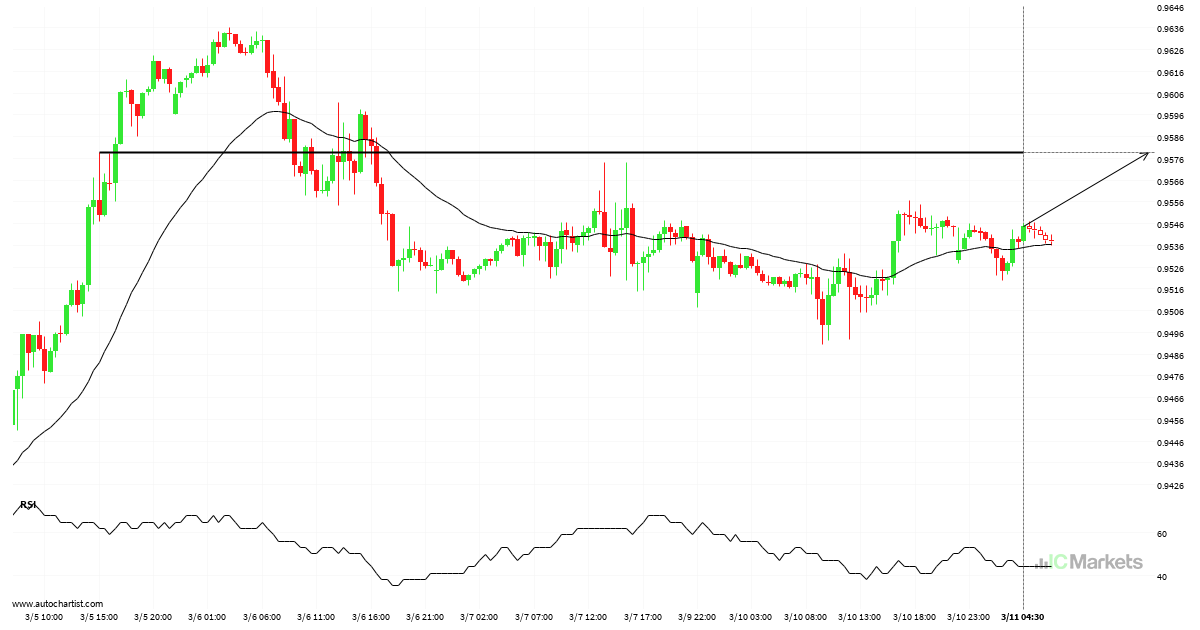
EURCHF acercándose a un importante nivel alcista clave
El EURCHF avanza hacia la línea de 0.9578, que ya ha probado en numerosas ocasiones durante el pasado. Hemos observado un retroceso desde esta posición en el pasado, por lo que en esta fase no está claro si atravesará este precio o se recuperará como ya hizo antes. Si el EURCHF continúa con esta trayectoria, […]

EURCHF กำลังไปที่ระดับสำคัญแบบ bullish
EURCHF กำลังเคลื่อนตัวไปยังเส้นของ 0.9578 ซึ่งได้มีการทดสอบมาแล้วหลายครั้งในอดีต เราเคยเห็นว่าราคาได้ย่อตัวจากตำแหน่งนี้มาก่อนในอดีต ดังนั้นในขั้นนี้มันยังไม่ชัดเจนว่าราคาจะสามารถทะลุผ่านราคานี้หรือเกิดการรีบาวน์เหมือนก่อนหน้านี้ ถ้าหาก EURCHF ดำเนินต่อไปในทิศทางปัจจุบัน เราสามารถคาดหวังได้ว่าราคาจะไปที่ 0.9578 ภายใน 18 ชั่วโมงถัดไป
Mudança dramática em EURGBP. Um sinal do que está por vir?
EURGBP subiu acentuadamente por 8 horas – que é um movimento excessivamente grande para este instrumento; excedendo 98% dos movimentos de preços passados. Mesmo que esse movimento seja um sinal de uma nova tendência em EURGBP, há uma chance de testemunharmos uma correção, por mais breve que seja.

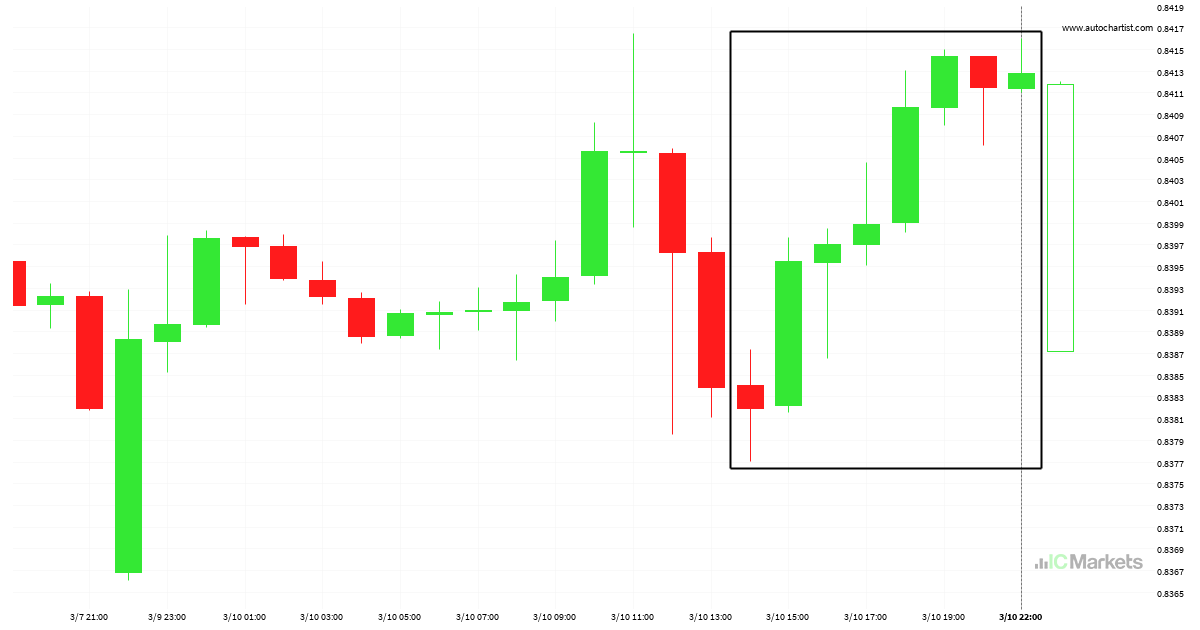
Cambio dramático en EURGBP. ¿Una muestra de lo que vendrá?
El EURGBP ha ascendido un 0,37% de 0.83822 a 0.84131 en 8 horas.