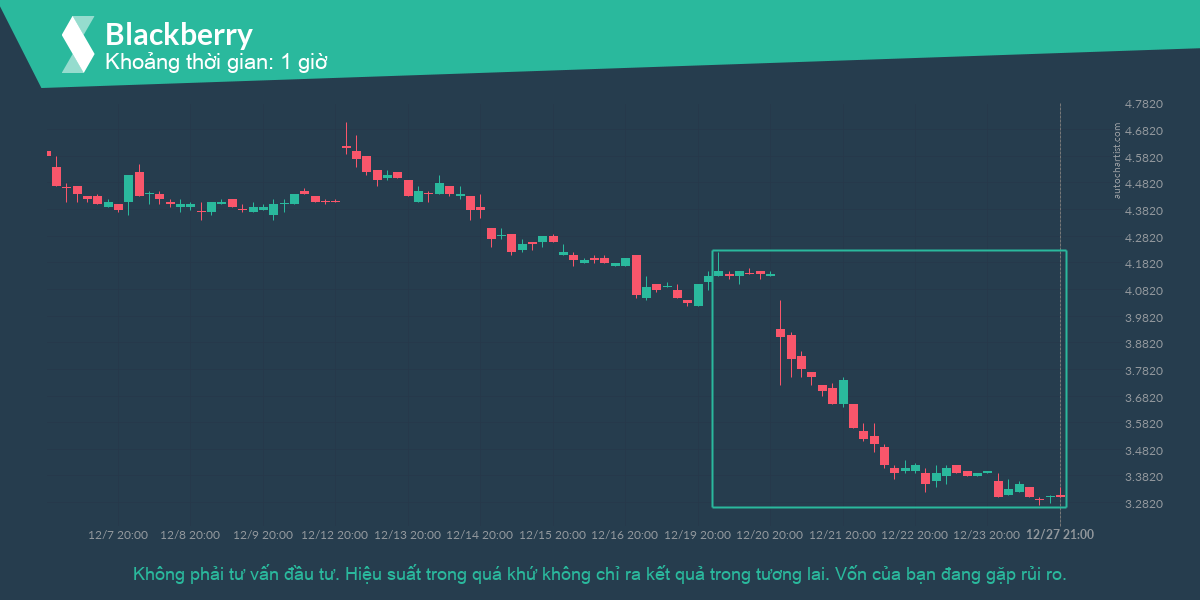
Những người đầu tư theo xu hướng có lẽ đang háo hức theo dõi Blackberry để xem liệu sự biến động 20,48% mới nhất của nó có tiếp tục hay không. Nếu không, những người có ý định ngược lại sẽ rất vui với biến động đặc biệt lớn 8 ngày.
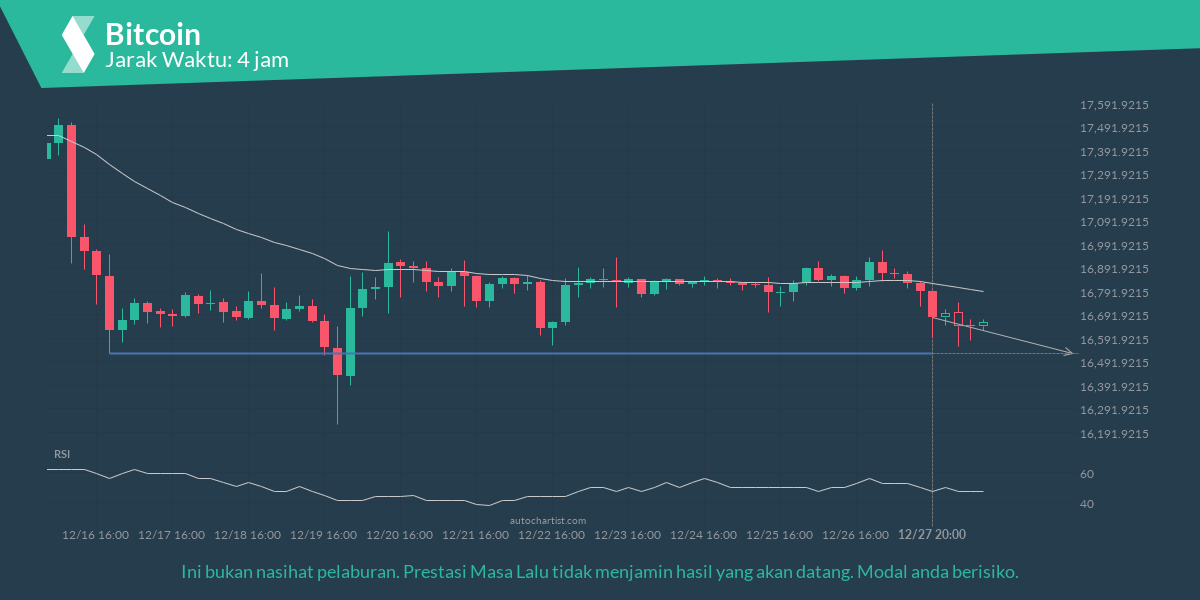
Bitcoin sedang bergerak ke arah garis sokongan. Oleh kerana kita telah melihatnya menjejak semula dari tahap ini pada masa lalu, kita boleh melihat sama ada menembusi garisan ini, atau lantunan kembali ke tahap semasa. Ia telah menyentuh garis ini berkali-kali dalam 12 hari dan boleh mengujinya sekali lagi dalam 2 days.

Bitcoin đang di chuyển tới đường hỗ trợ. Vì chúng ta đã chứng kiến nó thoái lui khỏi mức này trong quá khứ, chúng ta có thể chứng kiến sự bứt ra khỏi đường này, hoặc bật trở lại các mức hiện tại. Nó đã chạm đường này nhiều lần trong 12 ngày gần nhất và có thể chạm nó lần nữa trong vòng
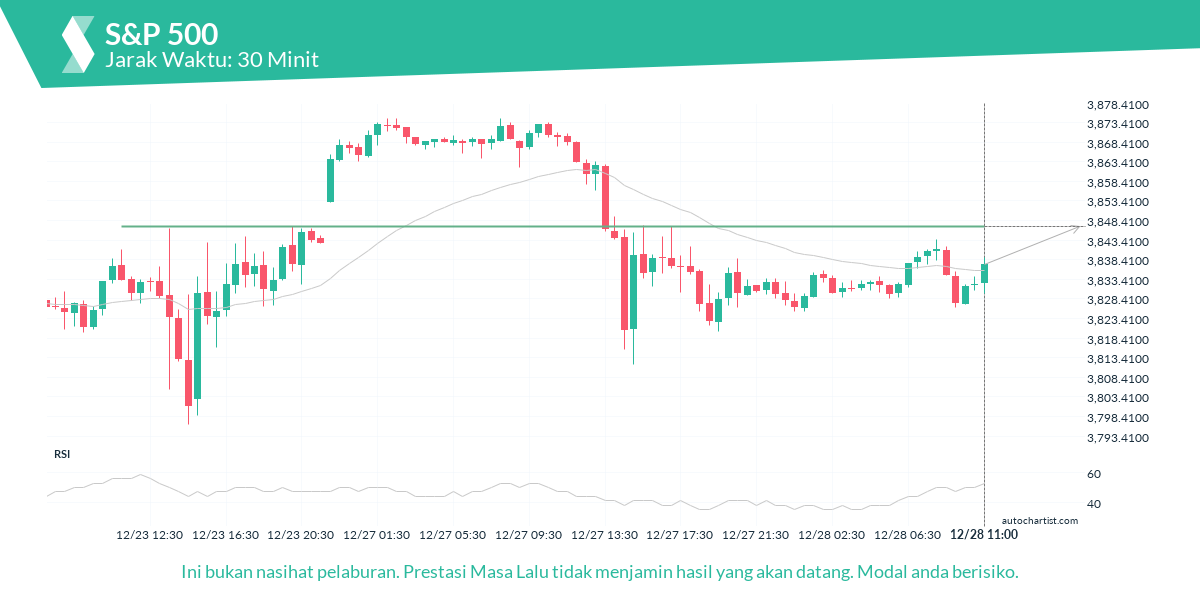
S&P 500 sedang menuju ke arah garis 3846.8999. Jika pergerakan ini berterusan, harga S&P 500 boleh menguji 3846.8999 dalam 11 jam. Tetapi jangan terlalu cepat untuk berdagang, ia telah menguji talian ini berkali-kali pada masa lalu, jadi pergerakan ini boleh menjadi singkat dan akhirnya melantun semula.
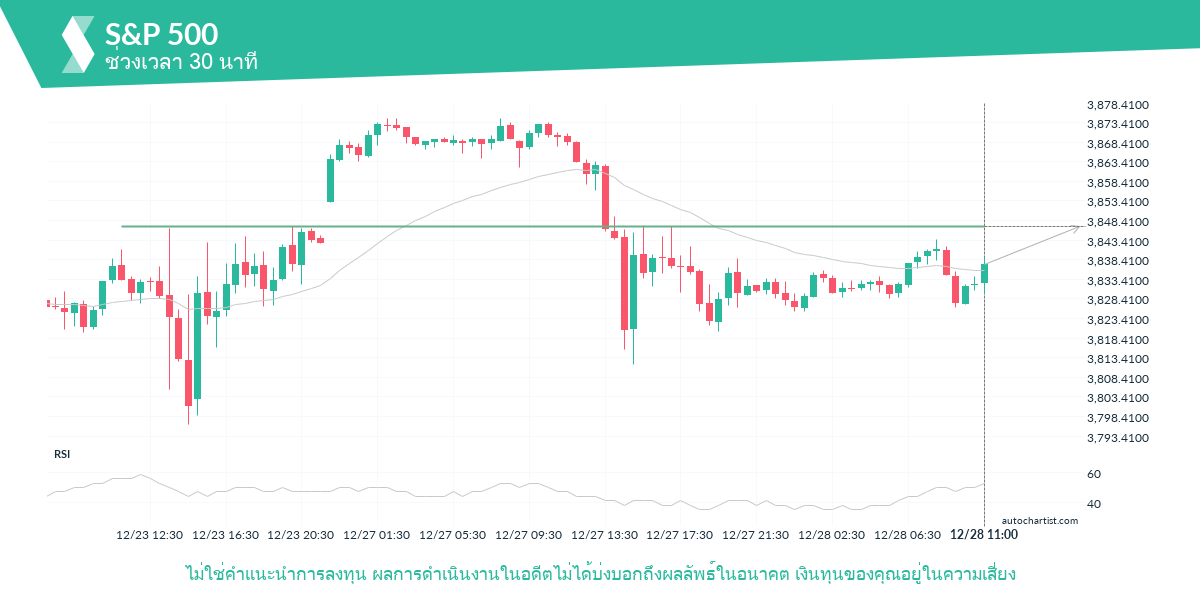
S&P 500 กำลังมุ่งหน้าไปยังเส้น 3846.8999 ถ้าหากการเคลื่อนตัวนี้ยังคงเกิดขึ้นต่อไปได้ เราคาดว่าจะเห็นราคาของ S&P 500 ไปทดสอบที่ 3846.8999 ภายในช่วง 11 ชั่วโมงถัดไป แต่อย่าพึ่งรีบทำการเทรด ราคาได้มาทดสอบเส้นนี้หลายครั้งแล้วในอดีต ดังนั้นการเคลื่อนตัวนี้อาจเกิดการรีบาวน์
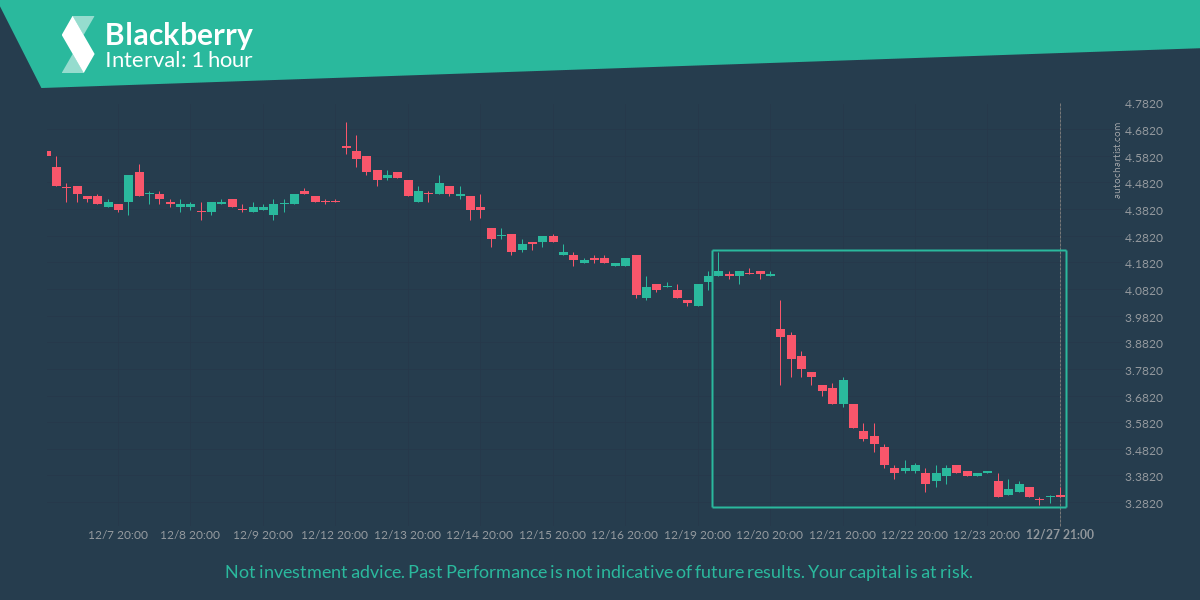
Those of you that are trend followers are probably eagerly watching Blackberry to see if its latest 20.48% move continues. If not, the mean-reversion people out there will be delighted with this exceptionally large 8 days move.

Bitcoin กำลังเคลื่อนที่ไปยังเส้นแนวรับของ แนวรับ เนื่องจากเราเคยเห็นราคาพักตัวจากตำแหน่งนี้มาก่อนในอดีต เราอาจได้เห็นการเบรคผ่านเส้นนี้หรือการรีบาวน์กลับไปยังเส้นปัจจุบัน ราคาได้มาแตะที่เส้นนี้แล้วหลายครั้งในช่วง 12 วันที่ผ่านมาและอาจกลับไปทดสอบอีกครั้งในช่วง 2 วันถัดไป
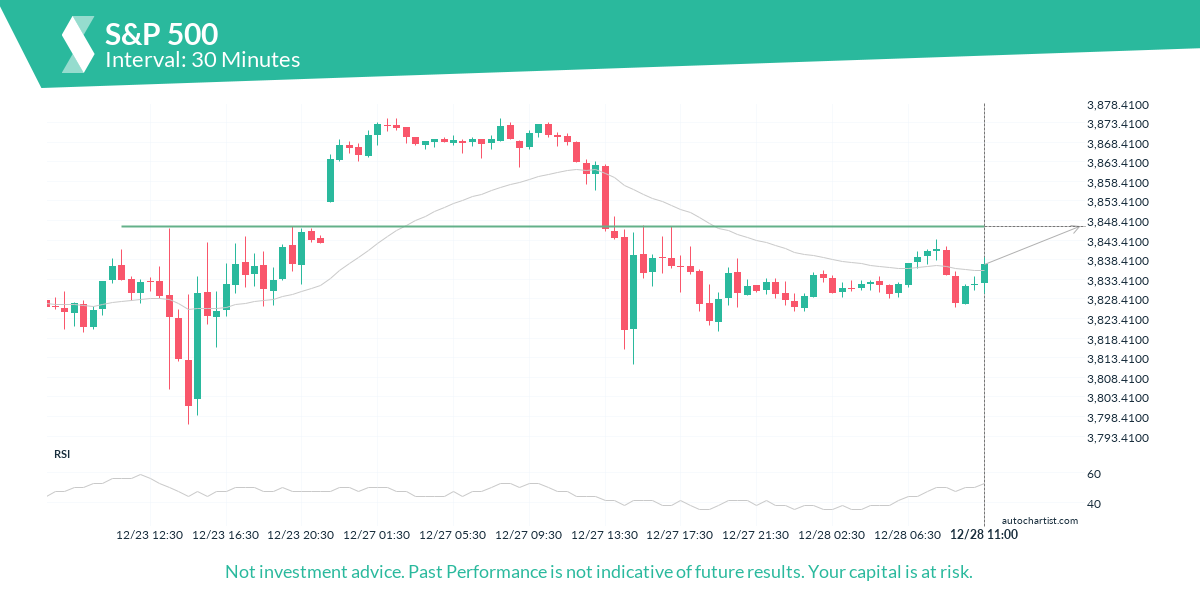
S&P 500 is heading towards a line of 3846.8999. If this movement continues, the price of S&P 500 could test 3846.8999 within the next 11 hours. But don’t be so quick to trade, it has tested this line numerous times in the past, so this movement could be short-lived and end up rebounding.
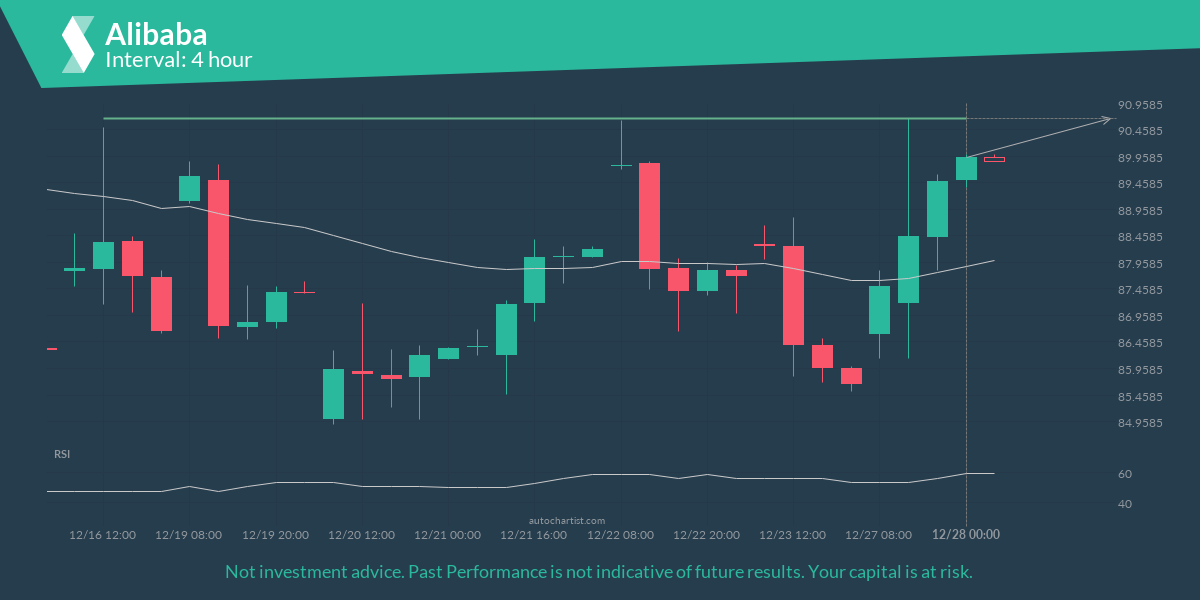
Alibaba is moving towards a line of 90.67 which it has tested numerous times in the past. We have seen it retrace from this position in the past, so at this stage it isn’t clear whether it will breach this price or rebound as it did before. If Alibaba continues in its current trajectory, we may see it move towards 90.67 within the next
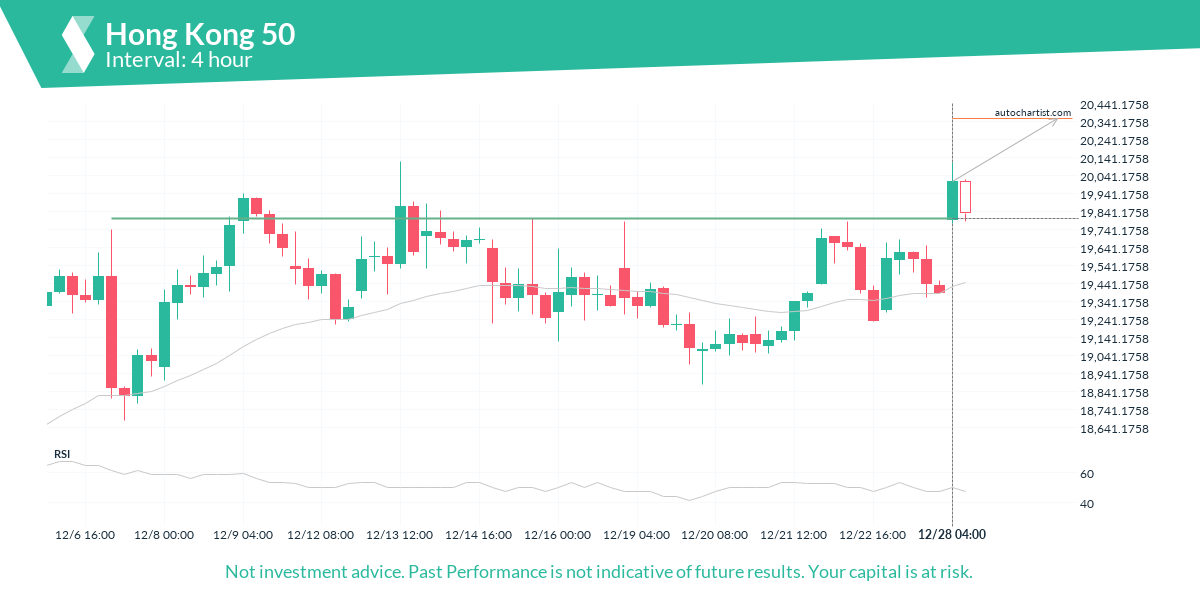
Hong Kong 50 has broken through a resistance line. It has touched this line numerous times in the last 22 days. This breakout shows a potential move to 20356.3008 within the next 3 days. Because we have seen it retrace from this level in the past, one should wait for confirmation of the breakout.


