

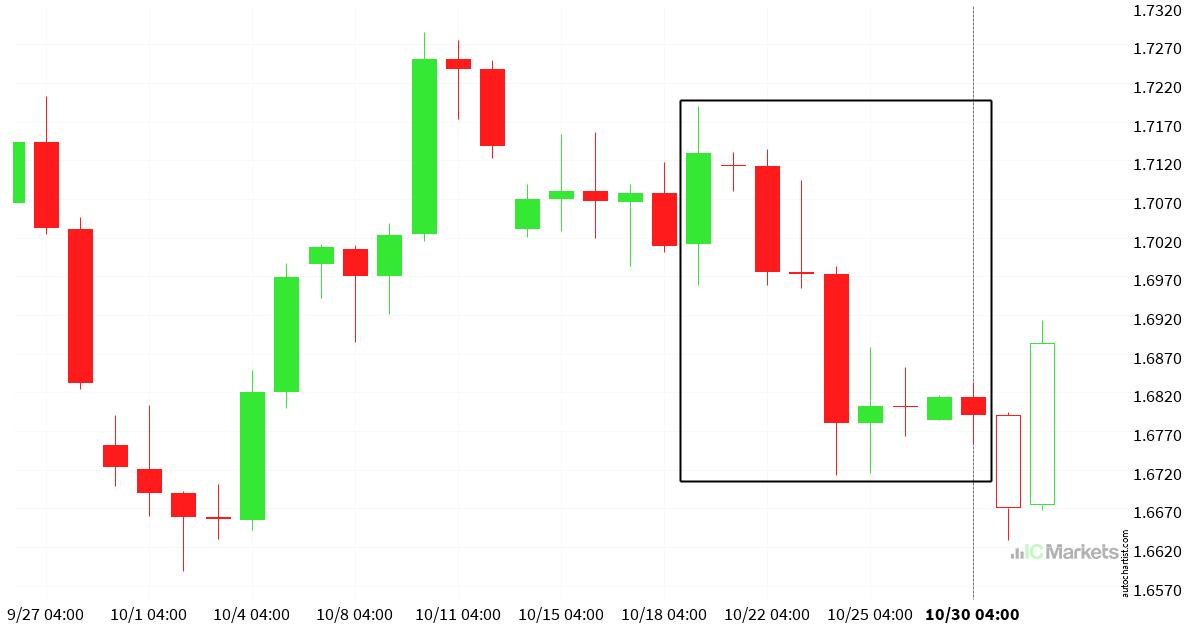
CBA – Chart Pattern – Channel Down
An emerging Channel Down pattern has been detected for CBA on the 30 Minutes chart. There may be a move toward 153.7627 in the next few candles. Once it reaches the resistance, it may continue its bullish run or revert to current price levels.
*** Risk Warning: Trading in securities involves significant risk. Prices may fluctuate and securities may become valueless. Losses may exceed deposits. These products are complex and require appropriate knowledge.
Open Trading Account Try a Free Demo