


CBA – Chart Pattern – Falling Wedge
The movement of CBA toward the support line of a Falling Wedge is yet another test of the line it has reached numerous times in the past. This test of the line could occur within the next 10 hours, but it is uncertain whether it will result in a breakout through this line or simply […]

XBRUSD – Key Level – Support
The price of XBRUSD is heading back toward the support area. It may struggle to break through and could reverse direction. The price may eventually break through, but it typically retreats from the level several times before doing so. *** Risk Warning: Trading in securities involves significant risk. Prices may fluctuate and securities may become […]
KO – Big Movement
A movement of 3.38% over 5 days on KO does not go unnoticed. You may want to consider where it is heading next: a continuation of the current downward trend or a reversal of the prior trend. *** Risk Warning: Trading in securities involves significant risk. Prices may fluctuate and securities may become valueless. Losses […]

BABA – Chart Pattern – Channel Up
BABA is trapped in a Channel Up formation, implying that a breakout is imminent. This is a strong trade setup for both trend and swing traders. It is now approaching a resistance line that has been tested before. Divergence watchers may be optimistic about a potential breakout, which could mark the start of a new […]

EURCHF – Key Level – Support
EURCHF is about to retest a key horizontal support level near 0.9318. It has tested this level 4 times recently and may simply bounce off it, as it did last time. However, after so many attempts, it may be ready to start a new trend. *** Risk Warning: Trading in securities involves significant risk. Prices […]

UNH – Chart Pattern – Triangle
An emerging Triangle pattern in its final wave has been identified on the UNH 1 hour chart. After a strong bullish run, UNH is heading toward the upper triangle trendline, with possible resistance at 330.3645. If the resistance holds, the Triangle pattern suggests a rebound toward current levels. *** Risk Warning: Trading in securities involves […]

XAUUSD – Key Level – Resistance
XAUUSD is heading toward 4244.7202 and could reach this level within the next 8 hours. It has tested this level numerous times in the past, and this time could be no different, ending in a rebound rather than a breakout. If a breakout does not occur, we may see a retracement back to current levels. […]

TCL – Chart Pattern – Triangle
It would be prudent to confirm the breakout that just occurred. Do you consider the move through support significant? Do you have indicators confirming that the price momentum will continue? If so, aim for a target of 14.8495, but consider reducing your position size as the price approaches that target. *** Risk Warning: Trading in […]

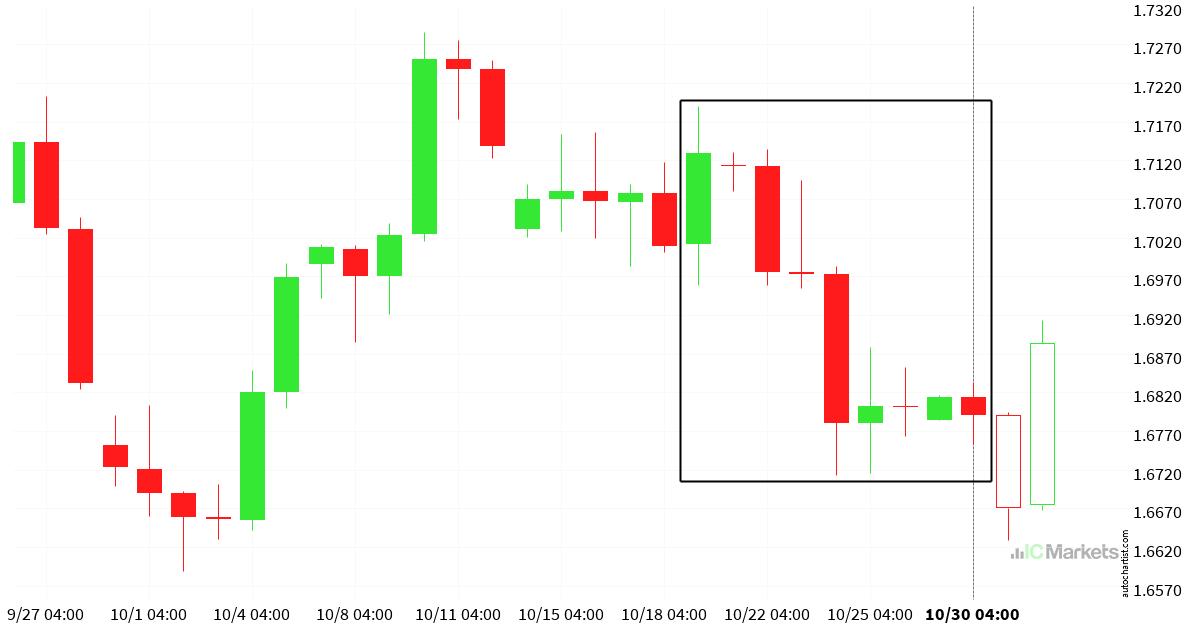
AUDUSD – Consecutive Candle
AUDUSD: Significant movement recorded. *** Risk Warning: Trading in securities involves significant risk. Prices may fluctuate and securities may become valueless. Losses may exceed deposits. These products are complex and require appropriate knowledge.

ES35 – Key Level – Resistance
ES35 has broken through a level at 16435.5996, suggesting a possible move to 16782.4102 within the next 3 days. It has tested this level numerous times in the past, so you should wait for confirmation of this breakout before taking any action. If the breakout does not confirm, we could see a retracement back to […]