

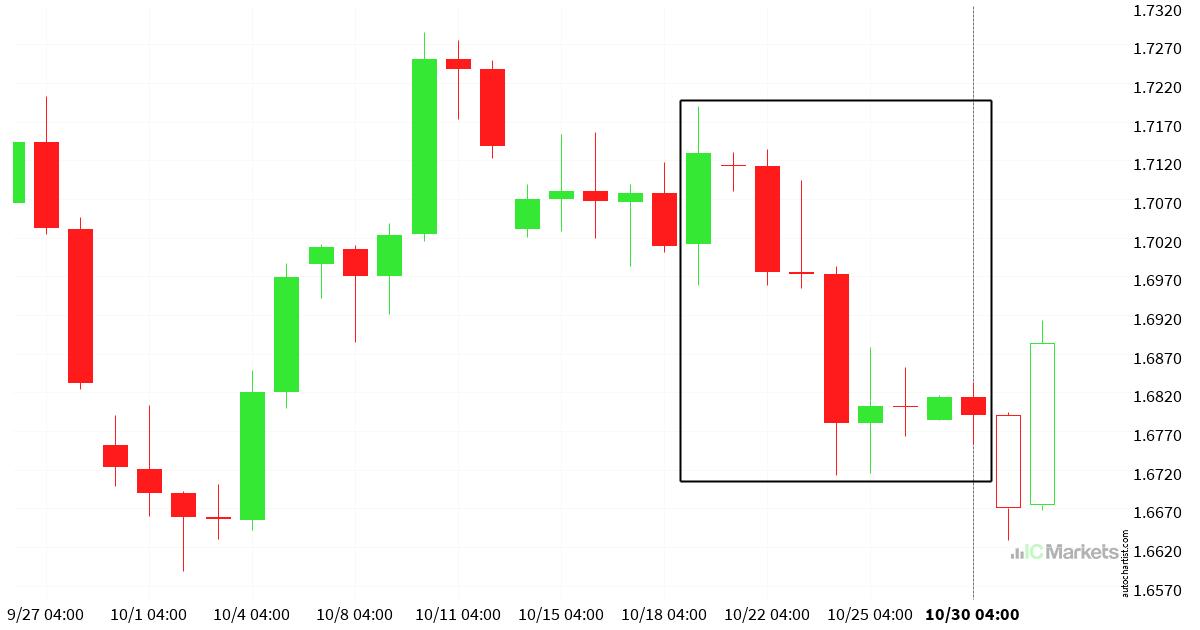
UK100 – Chart Pattern – Triangle
UK100 has broken through a support line of the Triangle chart pattern. If this breakout holds, we may see the price of UK100 test 9646.3313 within the next 2 days. But don’t rush to trade. It has tested this line before, so confirm the breakout before taking any action.
*** Risk Warning: Trading in securities involves significant risk. Prices may fluctuate and securities may become valueless. Losses may exceed deposits. These products are complex and require appropriate knowledge.
Open Trading Account Try a Free Demo